Ripple Is In A Downtrend And Targets The Low Of $0.31
Updated: Jan 06, 2023 at 11:48

Ripple (XRP) has continued to fall after being rejected at the $0.35 resistance level or the 21-day line SMA.
Long-term forecast for Ripple price: bearish
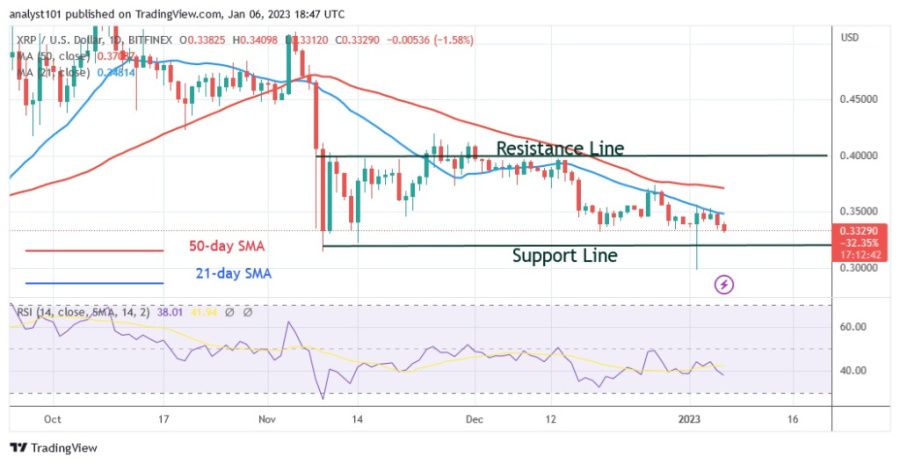
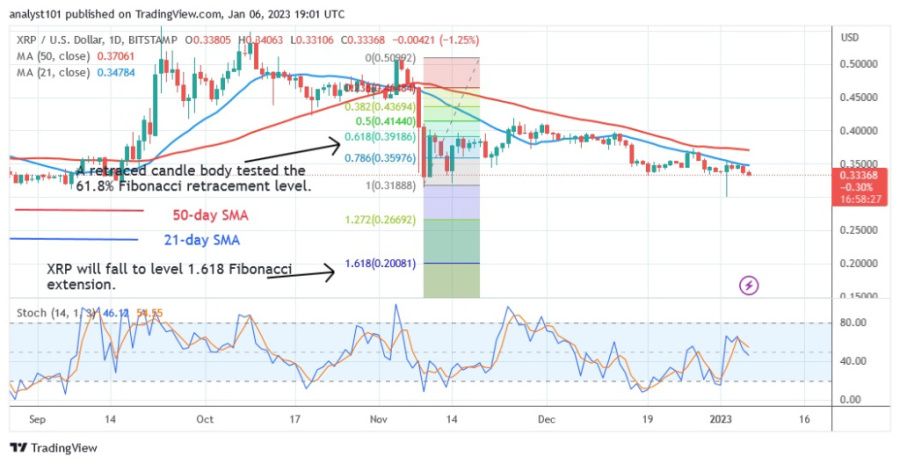
The cryptocurrency is expected to retest its recent low of $0.31, but it may find support. On January 2, the bears drove XRP to a low of $0.29, but the bulls struck. On January 2, the long candlestick tail showed strong buying at lower price levels. However, if the bears break the current support, XRP will fall to a low of $0.20. On the upside, further gains are unlikely as XRP is constrained by moving average lines and resistance at $0.35. XRP is currently trading in a narrow range between $0.31 and $0.35.
Ripple indicator analysis
In the 14th period, XRP has fallen below the Relative Strength Index level of 38. After the recent rejections, the cryptocurrency has continued to fall. The price bars are below the moving average lines, which means that the price will continue to fall. The altcoin is in a negative trend below the daily stochastic threshold of 60.

Technical indicators:
Key resistance levels - $0.80 and $1.00
Key support levels - $0.40 and $0.20
What is the next step for Ripple?
Ripple (XRP) is now declining, but it is limited to a range of $0.31 to $0.35. The altcoin is falling as it approaches its current support level of $0.31. If the current support holds, the movement within the range will continue for a few more days. However, if the current support is broken, the downtrend would resume.

Disclaimer. This analysis and forecast are the personal opinions of the author and are not a recommendation to buy or sell cryptocurrency and should not be viewed as an endorsement by CoinIdol. Readers should do their own research before investing
Price
News
Price
News

(0 comments)