Ripple Falters Above $0.32 as Buyers Fail to Resume Uptrend
Updated: Sep 16, 2022 at 10:59

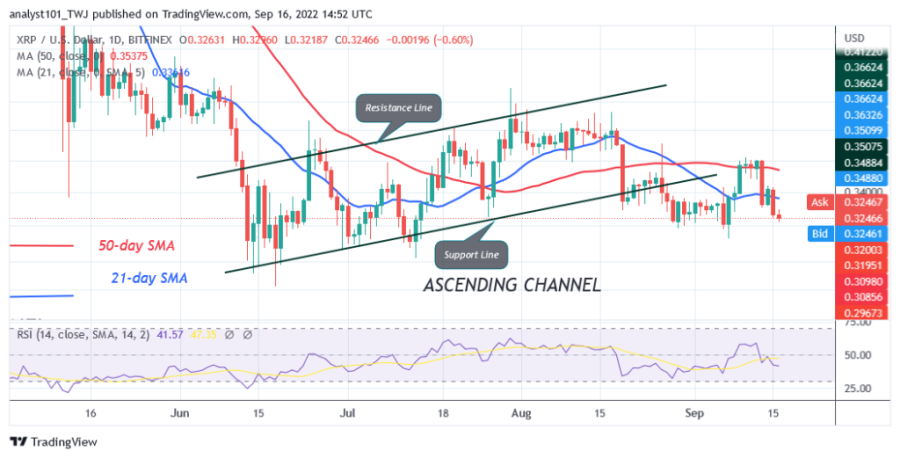
The price of Ripple (XRP) is in a downtrend as the altcoin drops below the moving average lines. Today, the cryptocurrency value is declining as buyers are unable to keep the price above the moving average lines.
Ripple price long-term forecast: bearish
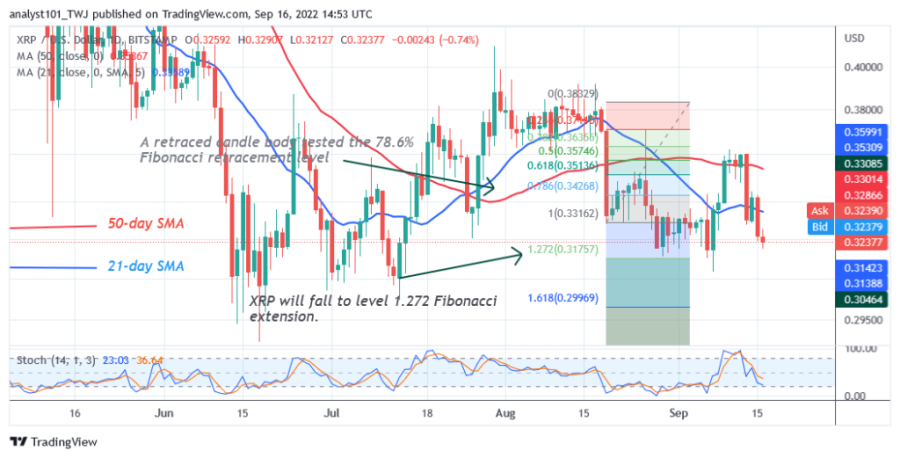
On August 19, Ripple fell to the low of $0.32 and failed to regain bullish momentum due to the downtrend. Buyers made efforts to regain upside momentum but were rebuffed. On September 14, buyers attempted to break the 21-day line SMA but were rejected. Today, XRP is falling back to the previous low. If the price falls below the support of $0.32, XRP will fall back to the lows of $0.32 and $0.30. On the other hand, XRP/USD will continue a sideways movement between $0.32 and $0.38 if the current price holds.
Ripple indicator analysis
Ripple is at level 42 of the Relative Strength Index for the period 14. The altcoin is in the downtrend zone after the recent decline. The price of XRP is below the moving average lines, which suggests a further decline. The altcoin is below the 40% area of the daily stochastic. This indicates that XRP is in a bearish momentum. The moving average lines are sloping north, which indicates an uptrend.

Technical Indicators
Key resistance zones: $0.40, $0.45, $0.50
Key support zones: $0.30, $0.25, $0.20
What is the next move for Ripple (XRP)?
Ripple will continue a sideways movement if it declines and holds above the $0.32 support. The cryptocurrency has previously turned away from a downtrend as it holds above the current support. The current support is marked by candlesticks with long extensions. The long candlesticks indicate strong buying at lower price levels.

Disclaimer. This analysis and forecast are the personal opinions of the author and are not a recommendation to buy or sell cryptocurrency and should not be viewed as an endorsement by CoinIdol. Readers should do their own research before investing
News
Price
News
Price
Price

(0 comments)