Ripple Coin Reaches Bearish Exhaustion Above $0.41 Support
Updated: Apr 14, 2024 at 22:09

The price of the Ripple coin (XRP) has fallen well below the moving average lines. Latest price analysis by Coinidol.com.
XRP long-term analysis: bearish
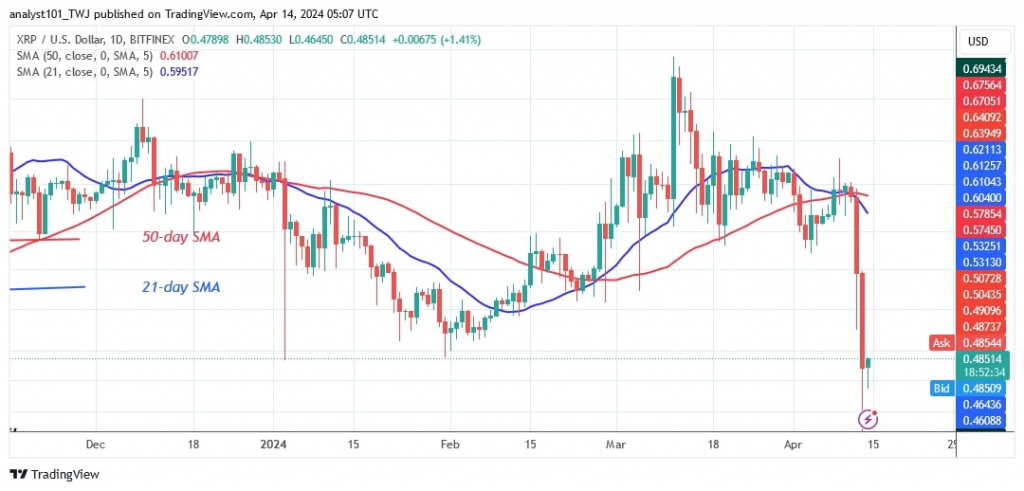
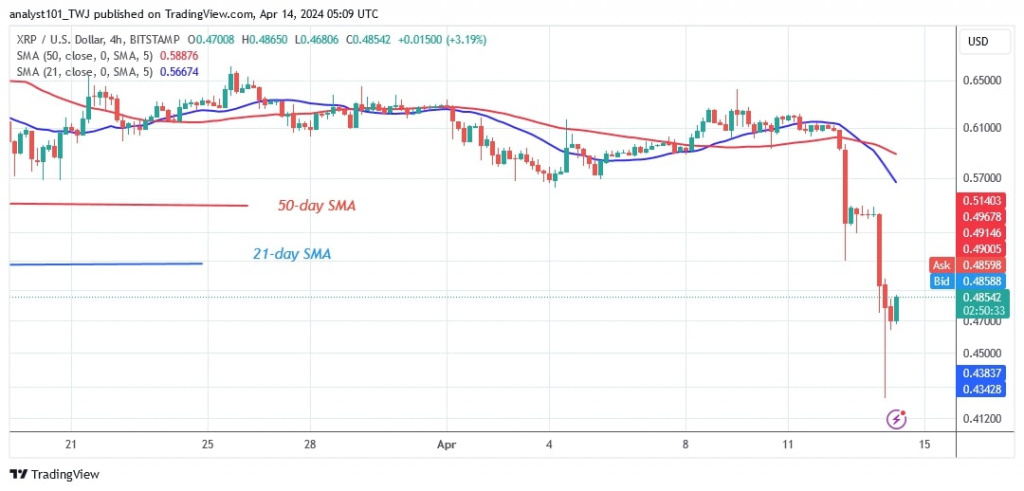
Previously, the cryptocurrency traded as reported by Coinidol.com, sideways between $0.56 and $0.66. On April 12, the bears broke through the current support level of $0.56 and extended their decline to the previous lows of $0.48 and $0.41. The support at $0.41 corresponds to the historical price level of August 17, 2023. Nonetheless, the bulls bought the dips as the altcoin corrected higher and remained above the $0.48 support.
On the downside, the altcoin will trade between the $0.48 support and the moving average lines if the current support holds. XRP will resume its uptrend if it breaks above the moving average lines. XRP is worth $0.48 at the time of writing.
XRP indicator analysis
The XRP price bars have fallen far below the moving average lines. On April 13, the long candlestick tail indicates significant buying pressure near the $0.41 support level. The altcoin has a bearish crossover when the 21-day SMA crosses below the 50-day SMA, which is a bearish sign.
Technical indicators:
Key resistance levels – $0.80 and $1.00
Key support levels – $0.40 and $0.20

What is the next direction for XRP?
The cryptocurrency has reached a bearish exhaustion after falling to a low of $0.41 before recovering. The altcoin is recovering above the support level of $0.48. The current dip on April 13, 2024 is a repeat of the price drop on August 17, 2024. XRP is recovering after staying above the $0.48 support level.

Disclaimer. This analysis and forecast are the personal opinions of the author and are not a recommendation to buy or sell cryptocurrency and should not be viewed as an endorsement by CoinIdol.com. Readers should do their research before investing in funds.
Price
News
Price
News

(0 comments)