Ripple Stuck Between $0.23 and $0.26 as Bulls and Bears Contemplate Next Move

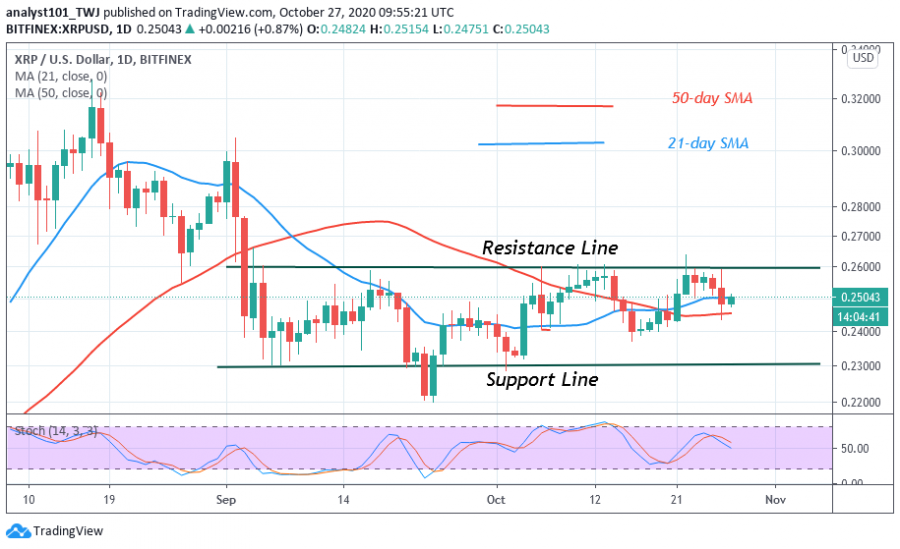
Since September 3, Ripple has been compelled to a range-bound movement because of the absence of buyers at higher price levels.
In other words, buyers were unable to break the $0.26 overhead resistance. Consequently, XRP is on a downward move after retesting the overhead resistance. Presently, Ripple is fluctuating between $0.23 and $0.26.
The selling pressure is likely to extend to the lower price range before resuming upward. Nonetheless, if the coin rebounds at the current support, the price will break the overhead resistance. Ripple will rally to a $0.30 high. In the meantime, XRP is retracing to the lower price range. A break below the $0.23 low will signal the resumption of the downtrend. Meanwhile, XRP is trading at $0.249 at the time of writing.
Ripple indicator analysis
The crypto is trading now in a horizontal channel. A break above the resistance line will propel the coin to reach a high of $0.30. On the other hand, a break below $0.23 will sink the coin to a $0.22 low. The 21-day and 50-day SMAs are sloping horizontally indicating the sideways trend.

Key Resistance Zones: $0.35, $0.40, $0.45
Key Support Zones: $0.25, $0.20, $0.15
What is the next move for Ripple?
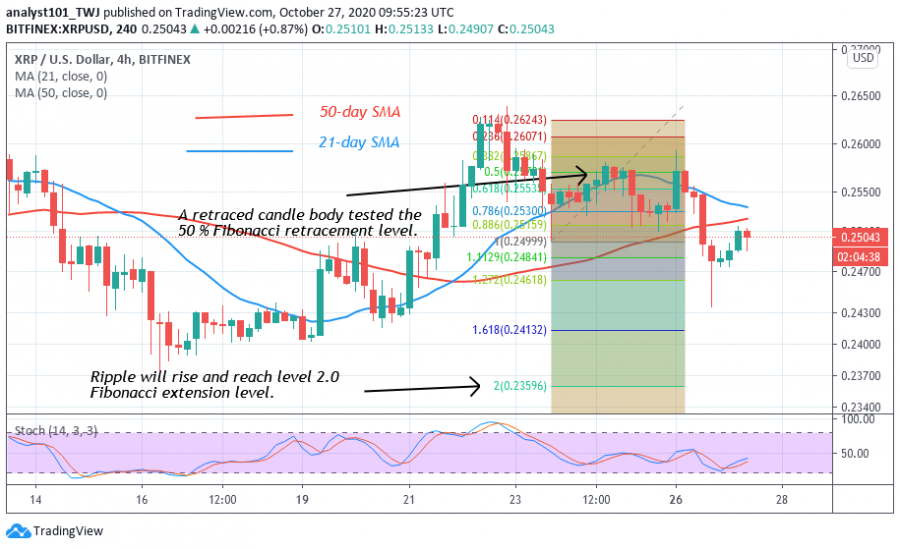
Following the recent rejection at $0.26, the crypto is likely to further depreciate on the downside. On October 23 downtrend; the retraced candle body tested the 50% Fibonacci retracement level. This indicates that XRP will further fall to a low at 2.0 Fibonacci extensions or $0.235 low.

Disclaimer. This analysis and forecast are the personal opinions of the author that are not a recommendation to buy or sell cryptocurrency and should not be viewed as an endorsement by CoinIdol. Readers should do their own research before investing funds.
News
Price
Price
Price
Price

(0 comments)