Ripple Rebounds above $0.32 as the Altcoin Resumes Sideways Move
Updated: Aug 23, 2022 at 10:35

Ripple (XRP) is falling back to its previous low after a failed upward correction.
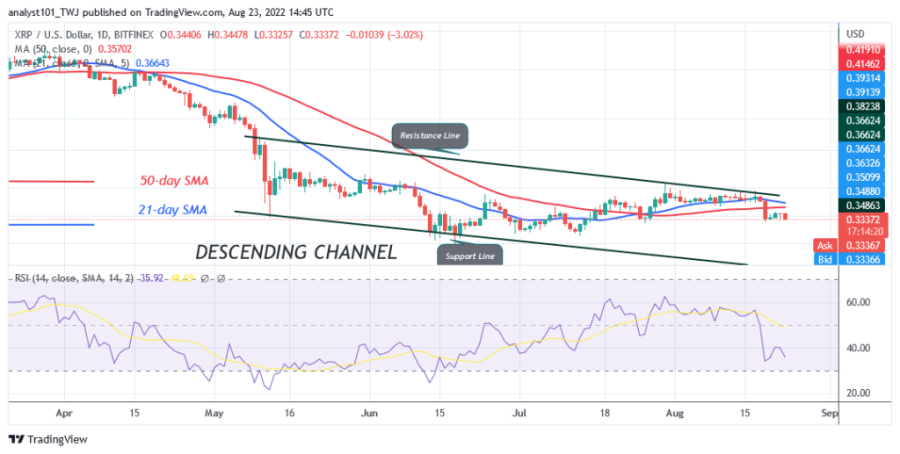
On August 19, XRP fell to the low of $0.32, but the bulls bought the dips. The upward correction reached the high of $0.34 but was staved off. XRP/USD resumed a new downtrend as the market regained the previous lows.
Bears will try to break the current support at $0.32 and push the altcoin to the low at $0.30. Today, XRP is falling and reaching the low of $0.33. If the cryptocurrency falls down, it will find support above $0.30. In other words, XRP will trade between $0.30 and $0.39 for a few days.
Ripple indicator analysis
Ripple is at level 36 of the Relative Strength Index for period 14. XRP is in the downtrend zone, but approaching the oversold area of the market. The price bars are still below the moving average lines, which will cause the altcoin to decline. The altcoin is below the 40% area of the daily stochastic. XRP is in bearish momentum.

Technical indicators
Key Resistance Zones: $0.40, $0.45, $0.50
Key Support Zones: $0.30, $0.25, $0.20
What is the next move for Ripple?
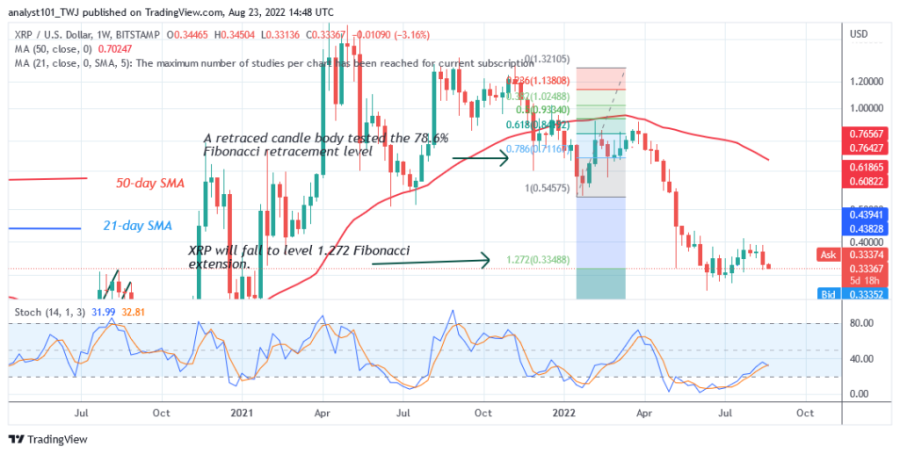
XRP/USD is in a downtrend after a recent upward correction. On the weekly chart, a candlestick tested the 78.6% Fibonacci retracement level on March 28. The retracement suggests that the XRP price will fall to the Fibonacci retracement level of $1.272 or $0.33. The price action shows that XRP is hovering above the $0.33 support and the bears are threatening to sell.

Disclaimer. This analysis and forecast are the personal opinions of the author and are not a recommendation to buy or sell cryptocurrency and should not be viewed as an endorsement by CoinIdol. Readers should do their own research before investing.
Price
News
Coin expert
News
Price

(0 comments)