Quant Price Recovers But Remains Below $114
Updated: Feb 18, 2024 at 19:50

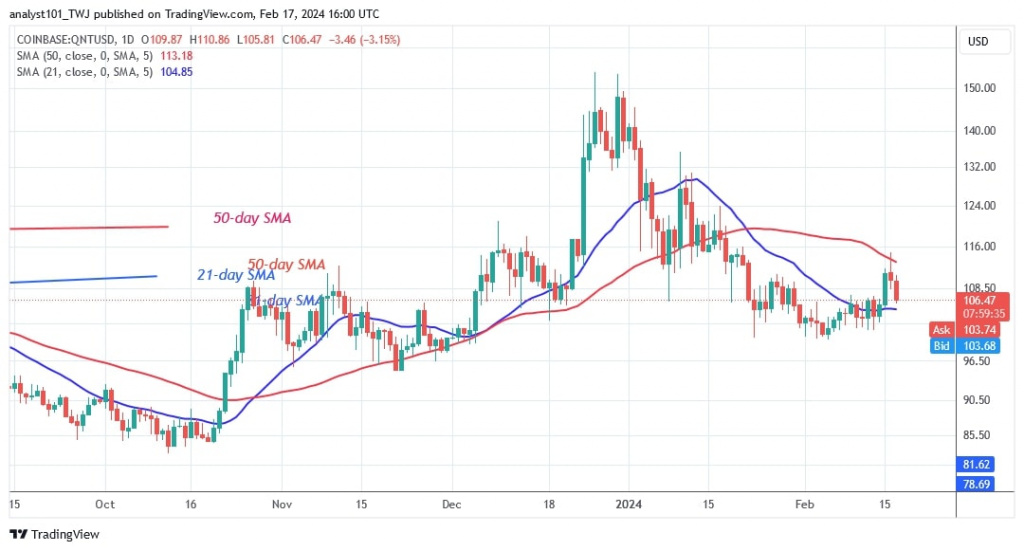
The price of Quant (QNT) has regained its positive momentum and has risen above the 21-day moving average.
Long-term Quant price forecast: bearish
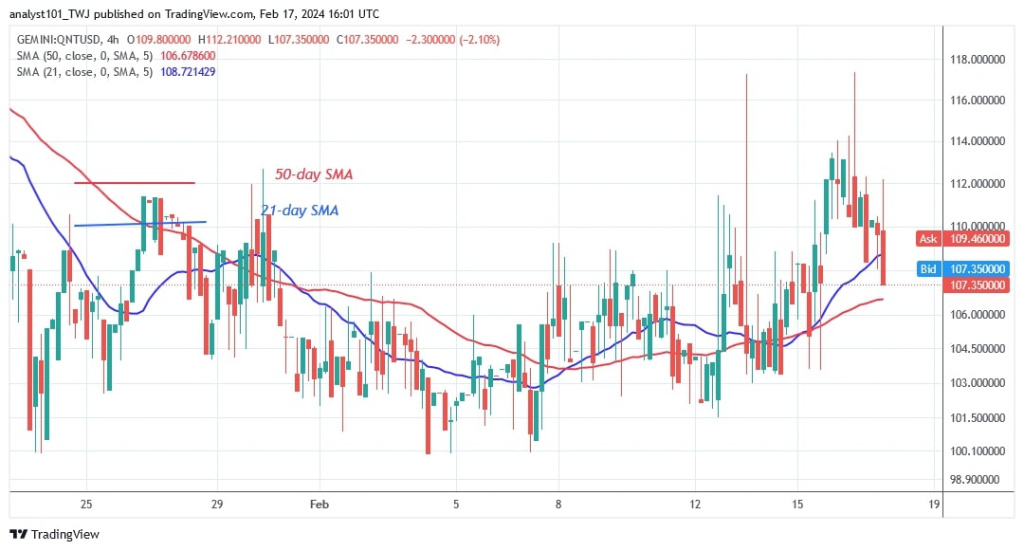
The bullish momentum is failing to break above the moving average lines. The cryptocurrency is stuck between two moving average lines. At the time of writing, the altcoin is trading at $107. If the bears break below the 21-day SMA, the Quant will fall and find support above its previous low of $100. It is unlikely that the cryptocurrency will rise much more. The cryptocurrency will fall much more if the existing support level of $100 holds.
Analysis of the quant price indicators
The cryptocurrency is trapped between the moving average lines. Quant will turn into a trend if the moving average lines are broken. The moving average lines have moved south despite the price rally. Doji candlesticks help to identify the price bars.
Technical Indicators
Key supply zones: $140, $150, $160
Key demand zones: $90, $80, $70

What is the next move for Quant?
On the 4-hour chart, the cryptocurrency is in a downtrend and trapped between the moving averages. Doji candlesticks mark the price activity. This has caused the delayed price movement. Quant will fall further if it loses its current support.

Disclaimer. This analysis and forecast are the personal opinions of the author and are not a recommendation to buy or sell cryptocurrency and should not be viewed as an endorsement by CoinIdol.com. Readers should do their research before investing in funds.
News
Coin expert
News
Price
Price

(0 comments)