Quant Price Bounces Over Its Crucial Support At $100
Updated: Feb 25, 2024 at 20:31

The price of Quant (QNT) has been falling recently and has reached its previous low again.
Long-term Quant price forecast: bearish
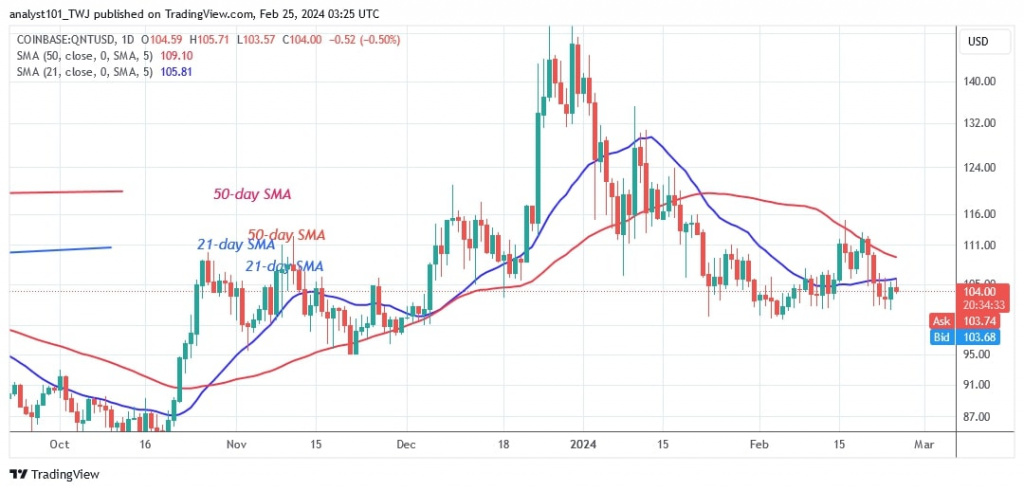
QNT/USD has been in a downtrend since January 23, 2024, with the altcoin failing to re-establish an upside momentum above the moving average lines. Although Quant has recovered since the previous week, it is still trapped between the moving average lines. The bullish momentum has stalled below the 50-day SMA. The altcoin has fallen below the moving average lines after two rejections at the 50-day SMA. At the time of writing, the altcoin is trading at $104.
The current support level of $100 has not been breached in the last month. The altcoin will fall to $95 if it loses its current support level.
Analysis of the quant price indicators
The price bars have returned below the moving average lines after being trapped between them. The altcoin is at risk of falling further below the existing support. Long candlestick tails at the current support indicate significant buying pressure.
Technical indicators
Key supply zones: $140, $150, $160
Key demand zones: $90, $80, $70

What is the next move for Quant?
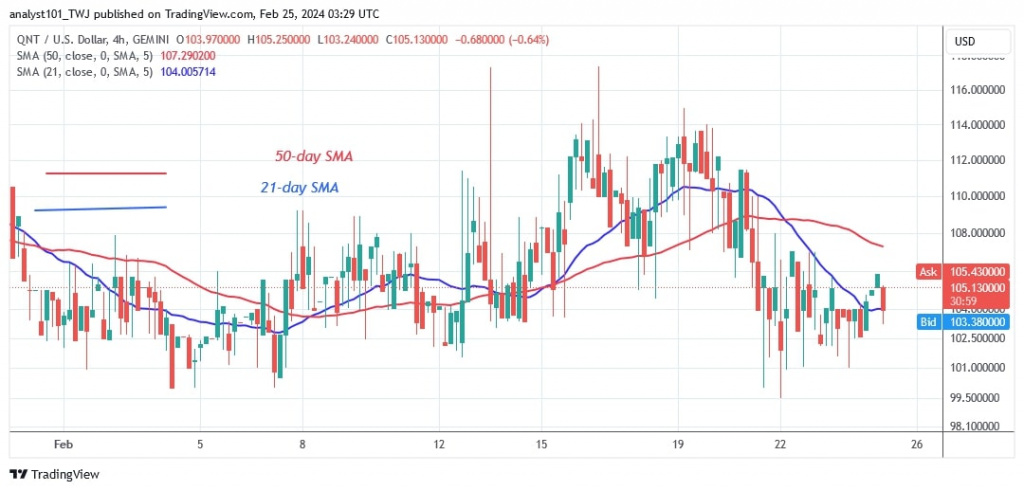
On the 4-hour chart, the cryptocurrency is consolidating above its current support of $100. The price of the cryptocurrency is oscillating both below and above the 21-day SMA. The presence of doji candlesticks has caused the price action to remain stationary. Long candlestick tails are helping the altcoin to bounce above the current support.

Disclaimer. This analysis and forecast are the personal opinions of the author and are not a recommendation to buy or sell cryptocurrency and should not be viewed as an endorsement by CoinIdol.com. Readers should do their research before investing in funds.
News
Coin expert
News
Price
Price

(0 comments)