Quant Pauses Over $115, But Tends To Move In A Range
Updated: Jan 06, 2024 at 13:20

The price of Quant (QNT) is falling after hitting the $150 resistance level twice. Price analysis by Coinidol.com.
Long-term Quant price prediction: ranging
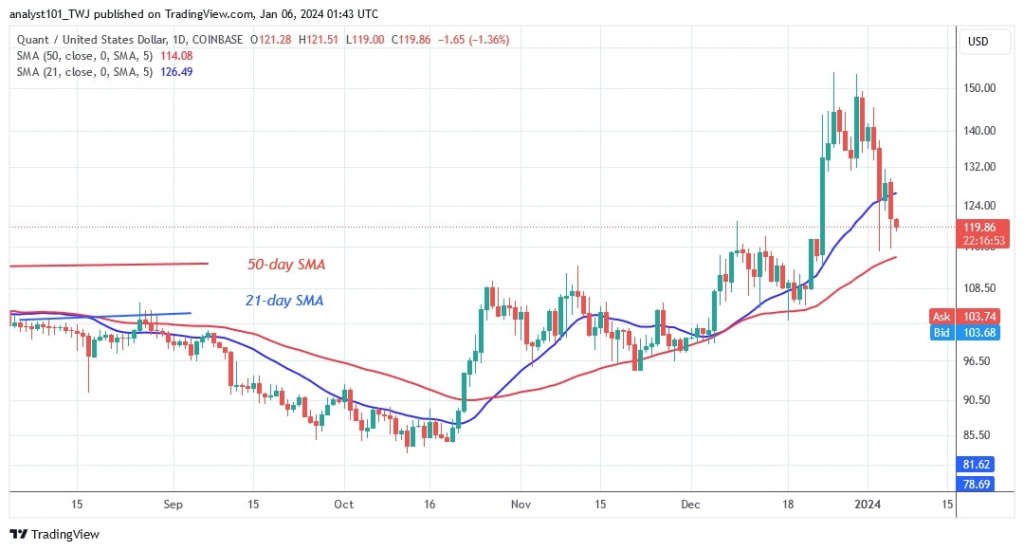
This will be the second rejection of the altcoin at its current high. QNT could reach its high of $230 if the current resistance is broken. The cryptocurrency value will be pushed back to its previous highs by buying after a previous decline. The current value of the coin is $120 at the time of writing. The current decline could go below the moving average lines, just like in the previous scenario. If the bears manage to break the 50-day simple moving average, the market will fall to $108.
Analysis of the Quant price indicator
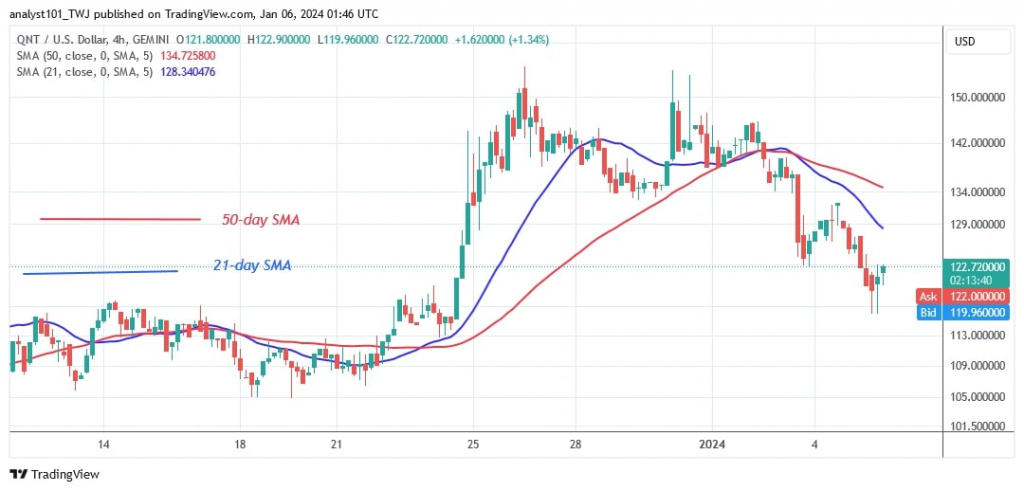
QNT was rejected at $150 and is currently stuck between the moving average lines. In the meantime, the moving average lines are trending higher despite the decline. Prices have a tendency to move between the moving average lines. The 4-hour chart shows a recent decline with the price bars below the moving average lines.
Technical Indicators
Key supply zones: $140, $150, $160
Key demand zones: $90, $80, $70

What is the next development for Quant?
After rejecting the recent high, Quant is now in a downtrend. The current downtrend is slowing down as it is moving between the moving average lines. If the downtrend is stopped above the 50-day SMA, the uptrend will begin. However, if the 50-day SMA support is broken, QNT will fall much further.

On December 26, the altcoin reached a high of $153 before falling back again as Coinidol.com reported before.
Disclaimer. This analysis and forecast are the personal opinions of the author and are not a recommendation to buy or sell cryptocurrency and should not be viewed as an endorsement by CoinIdol.com. Readers should do the research before investing in funds.
News
Coin expert
News
Price
Price

(0 comments)