Quant On The Verge Of Falling As Bears Freeze $92 Low
Updated: May 28, 2024 at 10:15

The price of Quant (QNT) is falling while in a sideways trend. New price analysis by Coinidol.com.
Long-term quant price prediction: bearish
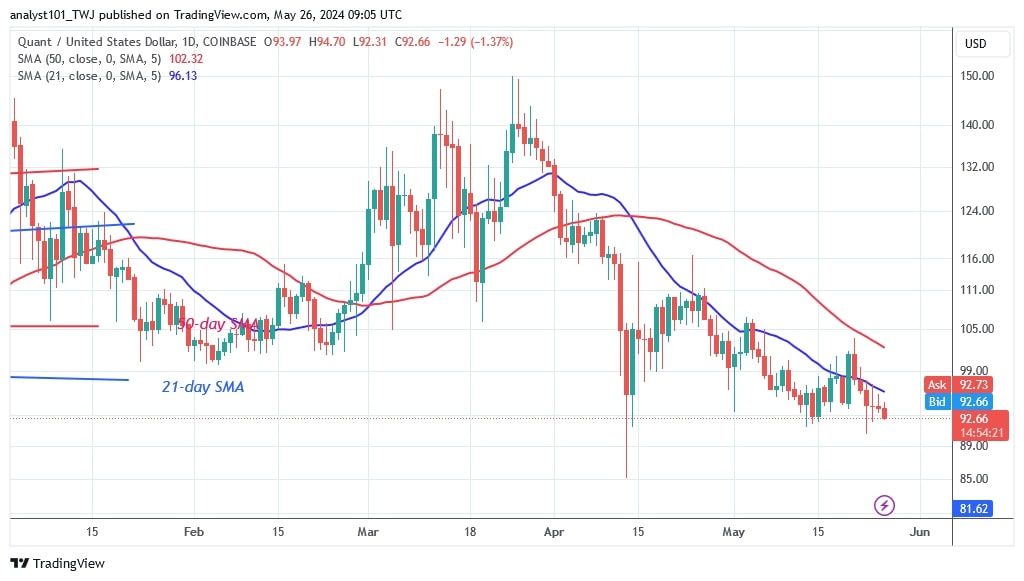
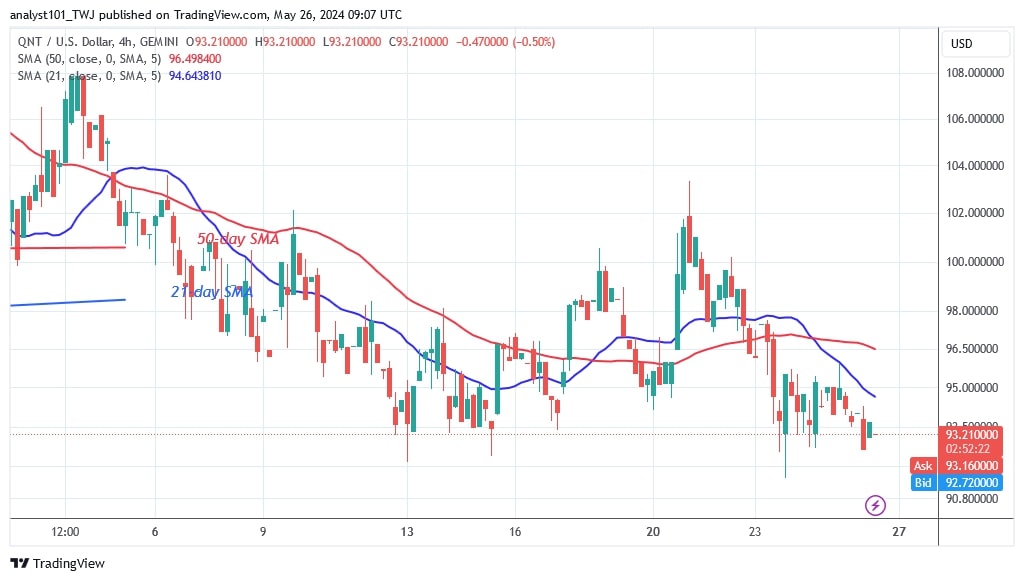
The altcoin has been trading within a range of $91.50 and below the moving average lines. The current price range has narrowed and the bears have broken through the key support level at $100.
Today, QNT is in a downtrend with a current value of $91.72. The altcoin is bearish and approaching its previous low of $91.50.
If the bears break the $91.50 support, the altcoin will fall to its previous low of $85. However, if QNT finds support at $91.50, it will resume its uptrend.
Quant price indicator analysis
Quant is falling because the price bars of both charts are below the moving average lines. Likewise, the moving average lines are showing a bearish crossover with the 21-day SMA falling below the 50-day SMA, signaling a decline in the cryptocurrency.
Technical indicators
Key supply zones: $140, $150, $160
Key demand zones: $90, $80, $70

What is the next development for Quant?
QNT/USD is in a downtrend but has held above the $92 support level since May 12, as reported by Coinidol.com previously. The bears have retested and broken through the existing support three times. Long candlestick tails point to lower price levels, including the previous low of $85. The altcoin is showing strong buying pressure at lower prices.

Disclaimer. This analysis and forecast are the personal opinions of the author and are not a recommendation to buy or sell cryptocurrency and should not be viewed as an endorsement by CoinIdol.com. Readers should do their research before investing in funds.
Price
News
Price
Price
Price

(0 comments)