Quant Bounces Back On Resumption Of The Uptrend

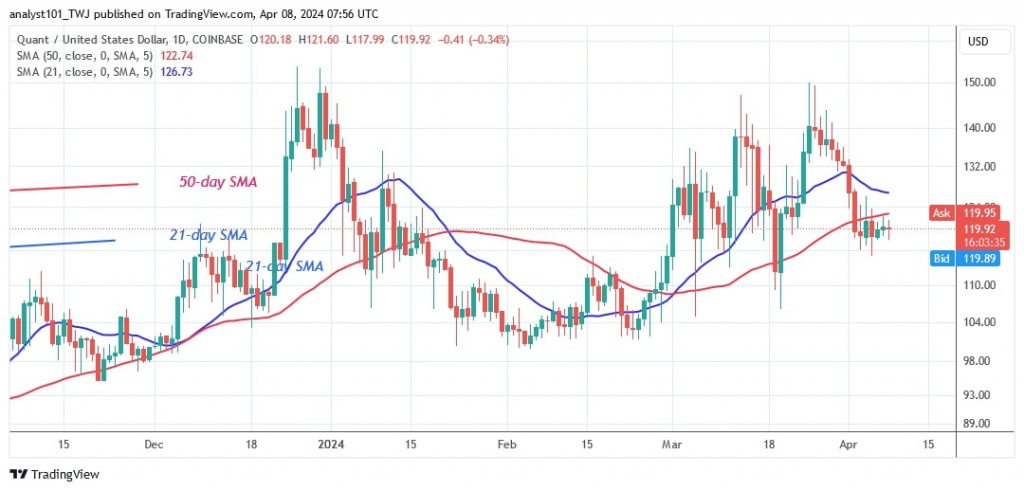
The price of Quant (QNT) has slipped below moving average lines after encountering resistance twice near the $150 high.
Quant price long term forecast: bearish
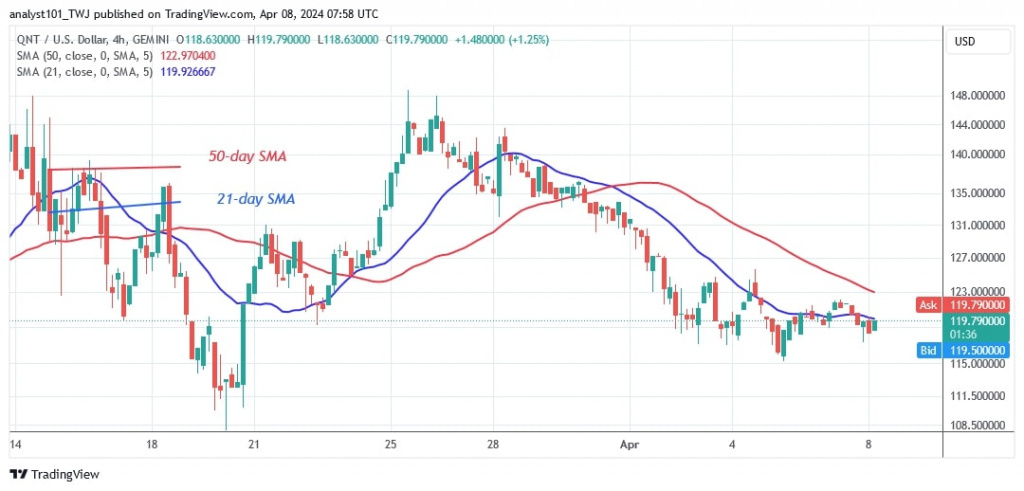
According to price analysis by Coinidol.com, Quant has fallen to a low of $117-118 at the time of writing. Rejection has slowed the recovery process. QNT has recovered from its previous decline.
On the upside, buyers are trying to lift the altcoin above the moving average lines. Should the buyers succeed in breaking the moving average lines, QNT is expected to resume its uptrend. The altcoin will fall even further to $106 if it is rejected at the moving average lines.
Analysis of the quant price indicator
After the recent decline, the cryptocurrency's price bars are now below the moving average line. The moving average lines are trending upwards, indicating the previous rise. QNT's price activity is characterized by candlestick wicks. The long candlestick wick indicates strong selling pressure at $150.
Technical indicators
Important supply zones: $140, $150, $160
Important demand zones: $90, $80, $70

What is the next development for Quant?
QNT drops below the moving average lines. The cryptocurrency's uptrend has already been halted four times at the $150 mark due to significant selling pressure. The altcoin will be forced to move above the $101 support and below the moving average lines where QNT will face a rejection of the recent high.

Disclaimer. This analysis and forecast are the personal opinions of the author and are not a recommendation to buy or sell cryptocurrency and should not be viewed as an endorsement by CoinIdol.com. Readers should do their research before investing in funds.
Price
News
Price
Price
News

(0 comments)