Polygon Oscillates In The Fight Against The $0.95 Resistance Level

The price of Polygon (MATIC) is recovering from its previous downturn.
Long-term Polygon price forecast: range
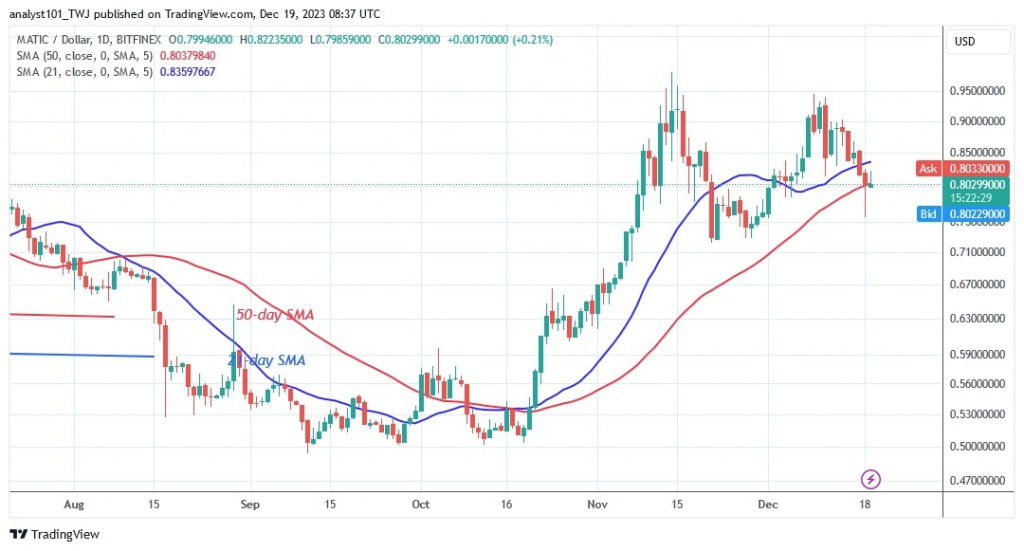
The upward correction ended on November 14 with a high of $0.95. MATIC has slipped between the moving average lines after two rejections. The altcoin is trading sideways below its recent high. Polygon will reach a high of $1.40 if the current resistance level is overcome. If buyers are unable to overcome the overhead barrier, the cryptocurrency will continue to trade sideways below the previous high. In other words, the market will oscillate between $0.75 and $0.95. At the time of writing, MATIC is worth $0.79.
Analysis of the polygon indicator
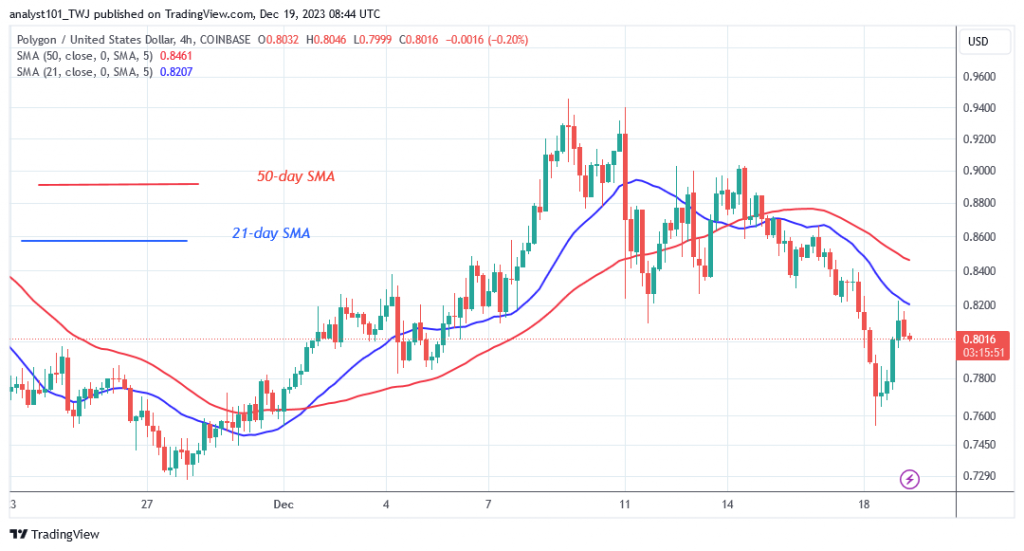
After the current downward movement, the price bars have fallen below the moving average lines. The downtrend is expected to continue in the lower price area. The moving average lines on the 4-hour chart are pointing downwards and signal a decline.
Technical indicators
Resistance levels: $1.20, $1.30, $1.40
Support levels: $0.60, $0.40, $0.30

What's next for Polygon?
Polygon is still in a sideways trend after overcoming the $0.95 hurdle. MATIC is bearish as it enters the lower $0.75 price area. If the current support holds, the market will resume its uptrend. The market will resume its move between $0.75 and $0.95.

On December 12, Coinidol.com reported that Polygon was forced into a sideways trend by the end of the uptrend. The price of the altcoin was fluctuating between $0.75 and $0.95.
Disclaimer. This analysis and forecast are the personal opinions of the author and are not a recommendation to buy or sell cryptocurrency and should not be viewed as an endorsement by CoinIdol.com. Readers should do their research before investing in funds.
Price
Blockchain
Price
Price
Price

(0 comments)