Polygon Falls Within Its Range After Rejection At $0.83

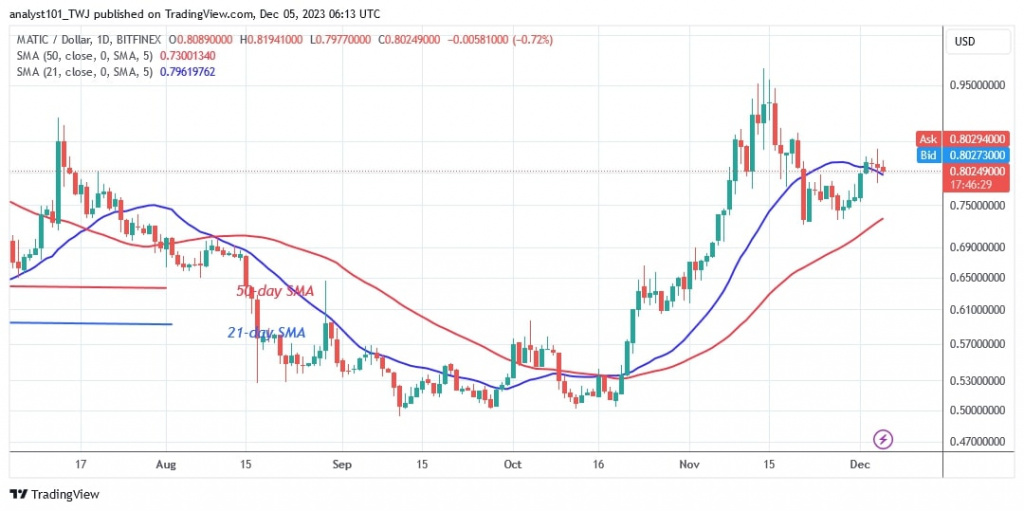
Polygon (MATIC) has been trading sideways since the end of the November 14 rally. The cryptocurrency fell to a low of $0.72 before continuing its sideways movement.
Polygon price long term forecast: ranging
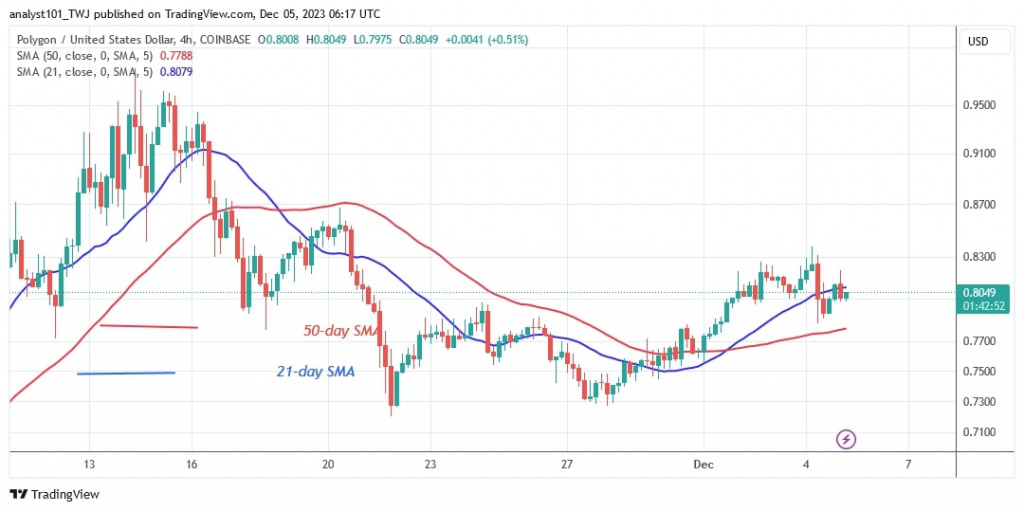
Cryptocurrency price analysis by Coinidol.com. The decline is likely to have continued to the low of $0.66 or below the 50-day simple moving average. Despite this, Polygon has made an upward correction above the moving average lines, but this has been rejected. If the price falls below the 21-day SMA, selling pressure will resume. At the time of writing, Polygon is trading at $0.80. The negative downtrend would continue if the 21-day SMA support is broken.
Polygon indicator analysis
The price of the cryptocurrency falls below the 21-day SMA, resulting in a low below the 50-day SMA. The failed upward correction will drive the cryptocurrency's downtrend. The moving average lines on the 4-hour chart are sloping horizontally due to the sideways trend.
Technical indicators
Resistance levels: $1.20, $1.30, $1.40
Support levels: $0.60, $0.40, $0.30

What is the next move for Polygon?
Polygon is falling and could reach the targeted low of $0.66. In the previous price action, the market hit a low of $0.72 before reversing higher. MATIC's projected price level will be reached if the bears manage to break through the current support.

Disclaimer. This analysis and forecast are the personal opinions of the author and are not a recommendation to buy or sell cryptocurrency and should not be viewed as an endorsement by CoinIdol.com. Readers should do their research before investing in funds.
Price
Price
Price
Price
News

(0 comments)