Polkadot Reaches Bearish Exhaustion And Could Reverse At $4.86

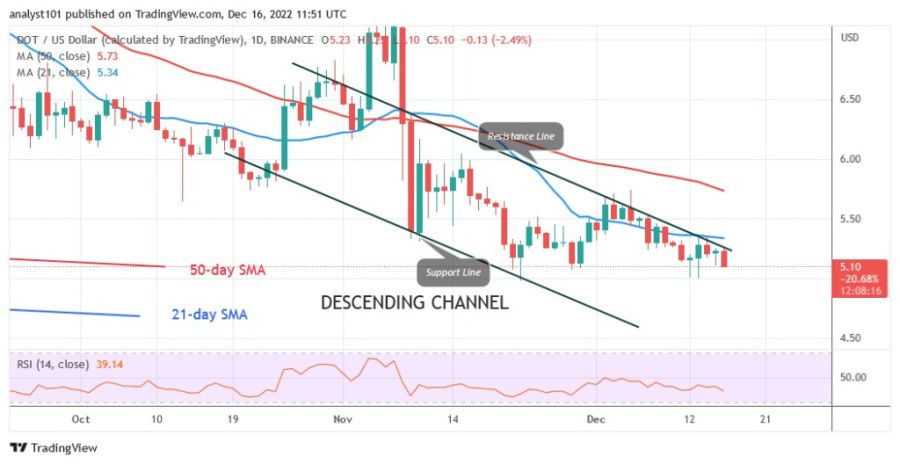
Polkadot (DOT) price has been trading above the $5.00 support since November 9. The cryptocurrency price has been fluctuating between $5.07 and $6.00.
Polkadot price long-term analysis: bearish
However, the resistance at $5.50 or the 21-day line SMA had slowed down the rising movements. Nevertheless, sellers will retest the $5.00 support to break it for the fourth time. Each time the $5.00 support is retested, the cryptocurrency will recover and move back in a range. Polkadot is now trading in the oversold zone of the market. There will likely be a reversal in the trend and the current selling pressure will subside.
Polkadot indicator analysis
The price of DOT is at the 38 level of the Relative Strength Index for the 14 period, indicating that the altcoin is in a bearish trend zone and could continue to decline. The cryptocurrency's price bars are declining and are below the moving average line. The price breaks and crosses the 21-day line SMA.

Technical indicators
Key resistance levels - $10 and $12
Important support levels - $6 and $4
What is the next direction for Polkadot?
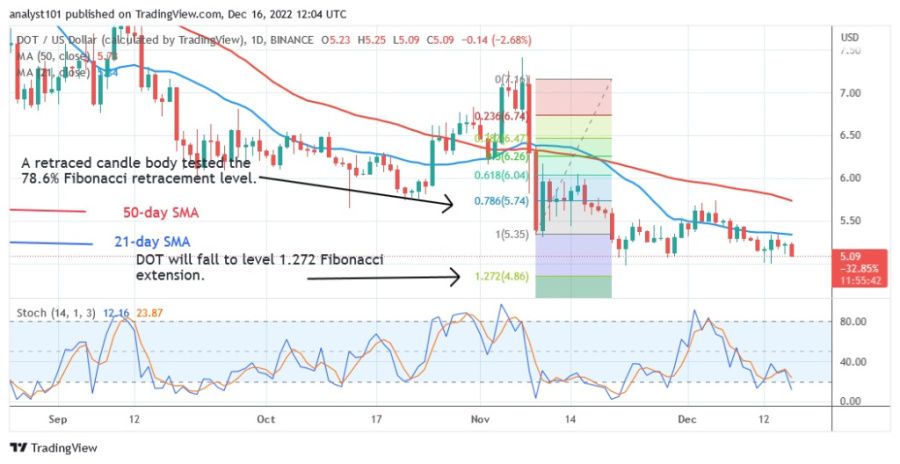
The gloomy outlook for Polkadot is exhausted. Even if DOT prices fall, bulls will buy the dips. The price of DOT turned up during the downturn on November 9 and a candlestick tested the 78.6% Fibonacci retracement level. After the correction, DOT will decline but turn around the 1.272 Fibonacci extension level or $4.86.

Disclaimer. This analysis and forecast are the personal opinions of the author and are not a recommendation to buy or sell cryptocurrency and should not be viewed as an endorsement by CoinIdol. Readers should do their research before investing in funds.
Coin expert
Price
Price
Coin expert
Price

(0 comments)