Polkadot Declines as It Retests Twice the $7.78 Resistance Level
Updated: Aug 27, 2022 at 13:52

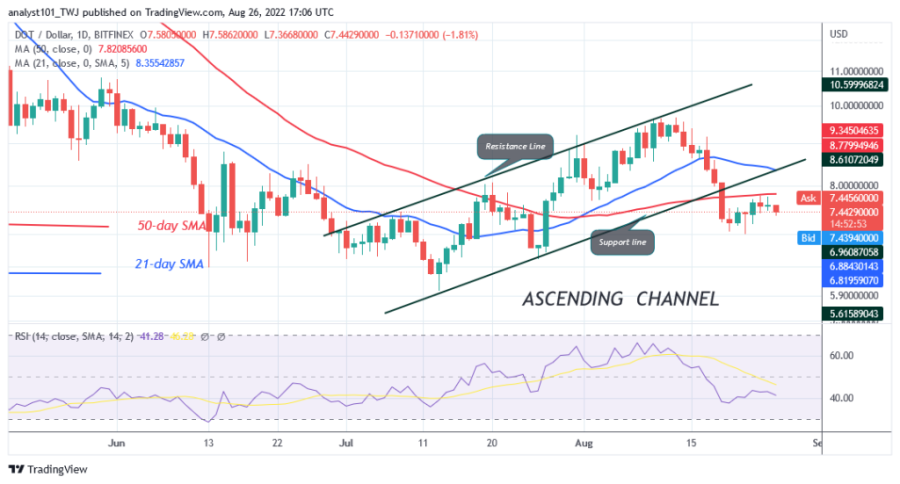
Polkadot (DOT) is in a downtrend as the altcoin trades below its moving average lines. On August 24, the price of DOT retested the 50-day line SMA, but was rejected.
On August 20, the price of Polkadot dropped and found support above the $7.04 level. Last week, the altcoin fluctuated above the current support but below the 50-day line SMA.
The DOT price movement was insignificant due to the presence of small candle bodies called doji and spinning tops. Price action is stagnant as buyers and sellers have reached a stage of indecision. If the bulls break above the moving average lines, the altcoin will rise and regain the upper resistance of $9.68. In the same sense, if the current support is broken, the cryptocurrency will continue to fall. This means that the cryptocurrency will continue to fall to the previous lows at $6.52 and $5.98.
Polkadot indicator analysis
Polkadot indicator is at level 41 of the Relative Strength Index for the period 14. DOT is in a downtrend zone and could fall further. Price bars are still fluctuating below the moving average lines, which will lead to further decline. DOT is below the 40% area of the daily stochastic. The market is in a bearish momentum.

Technical indicators
Key Resistance Zones: $10, $12, $14
Key Support Zones: $8.00, $6.00, $4.00
What is the next direction for Polkadot?
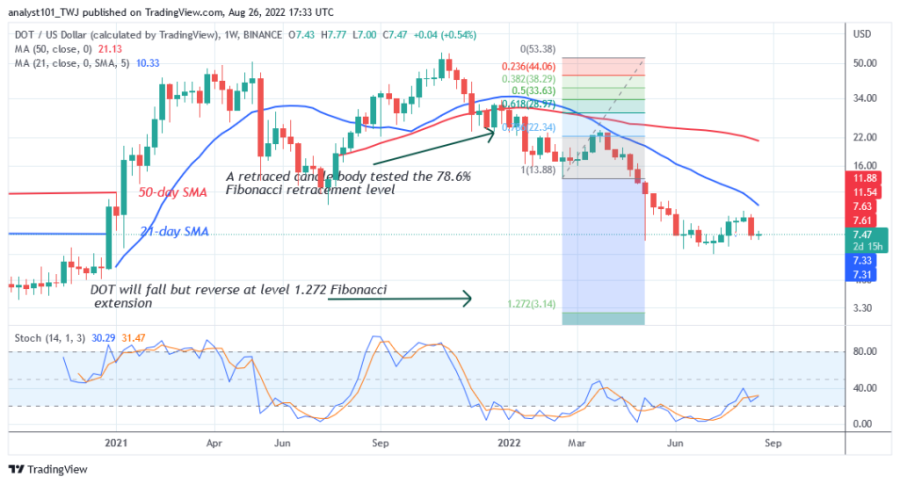
Polkadot is in an upward correction as it faces rejection at the $7.78 high. The altcoin is in a sideways movement as selling pressure is easing. On the weekly chart, a retraced candlestick tested the 78.6% Fibonacci retracement. The retracement suggests that DOT/USD will fall to the 1.272 Fibonacci extension level or the $3.14 level. The price action shows that the price of DOT has fallen to the low of $7.47.

Disclaimer. This analysis and forecast are the personal opinions of the author and are not a recommendation to buy or sell cryptocurrency and should not be viewed as an endorsement by CoinIdol. Readers should do their research before investing in funds.
News
Price
Price
News
Coin expert

(0 comments)