Bitcoin to Test a New Parabolic Trajectory & Trade $50,000+
Updated: Jul 19, 2020 at 21:22

A veteran commodity trader since 1980 Peter Brandt, who predicted both Bitcoin’s $20,000 hike and 80%+ fall to below $4,000, reveals it would not shock him if the price of Bitcoin – the leading crypto by market cap (MC) – entered a fresh parabolic phase. He thinks that BTC is following the same trends as those of 2015, that could result into 100x surge.
General TA rule -- violation of parabolic advance leads to 80%+ decline in value. If general rule is followed, BTC should retrace to <$4,000. Note: This Tweet does not make me a hater. pic.twitter.com/jDNI1osinU
— Peter Brandt (@PeterLBrandt) January 22, 2018
Some years back, an ostensible parabolic arc pattern was formed after a double bottommost pattern. The same pattern is occurring now, either from the late last year’s bottom of around $3120 or retest of this very value, BTC could well be stepping into a fresh phase, as per the expert.
He alludes that the latest chart is a coarse analog of the double bottom that happened four years ago. This nethermost followed the crash from the former pattern, that culminated in late 2013.
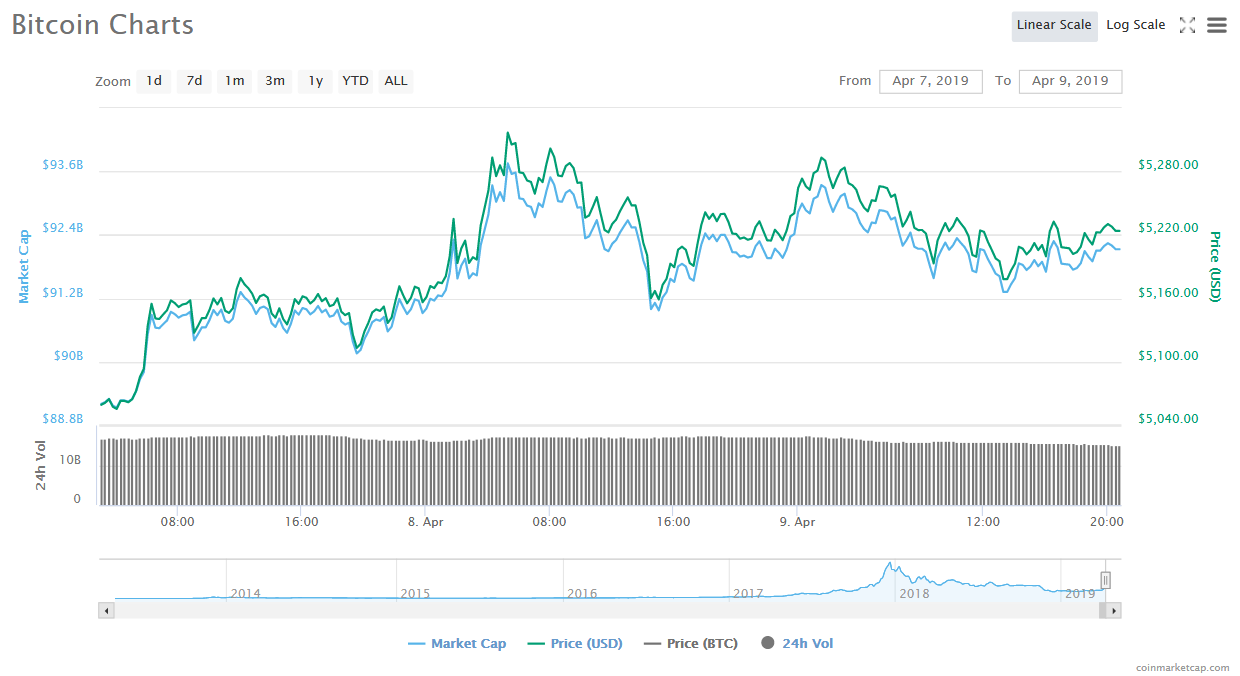
BTC/USD 24-Hour
Currently, the flagship crypto is trading at $5,222 (0.03% 24-hour), running to break the $5,300 ceiling. Its MC is sitting at $92.18 billion, according to CMC data. Meanwhile the total MC is at $180.37, which is still low by $5 billion – it had on April 8.
The cycle would be in proportion to the BTC’s forthcoming halving in 2020 that several expert analysts predict to trigger the price more upward.
The veteran trader has now set a target price for the flagship cryptocurrency of $50,000+ by 2021 (next 24 months). Considering the patterns that happened from 2013 to 2015 and then 2017 to 2018, Peter is optimistic the price will skyrocket significantly.
A Price of $100,000 is Possible
Nevertheless, we could first see a retrace before a retest. Through Twitter, Peter explained whether or not BTC would copy the 2013 – 2015 market tendency and further retest a bottom before furthering on with its parabolic course.
Either from Dec '18 low or from retest of same (circa analog dbl bottom in 2015) it would not surprise me if $BTC enters a new parabolic phase. $btcusd pic.twitter.com/XV89Qz7P4n
— Peter Brandt (@PeterLBrandt) April 5, 2019
All the indicators are showing Bitcoin to end this year in a more positive trajectory and also enter 2020 with a strong grip. Since the person that predicted the horizontal of Bitcoin in 2018, is now the same man sniffing a bullish momentum within the next few months portends fit for the prospect of the digital currency market.
In case Bitcoin enters a “new parabolic phase” then the chart proposes that the price of $100,000 could be seen on the market.
News
News
News
News
Price

(0 comments)