Litecoin Pushes on the Upside, Unable to Sustain Above $210

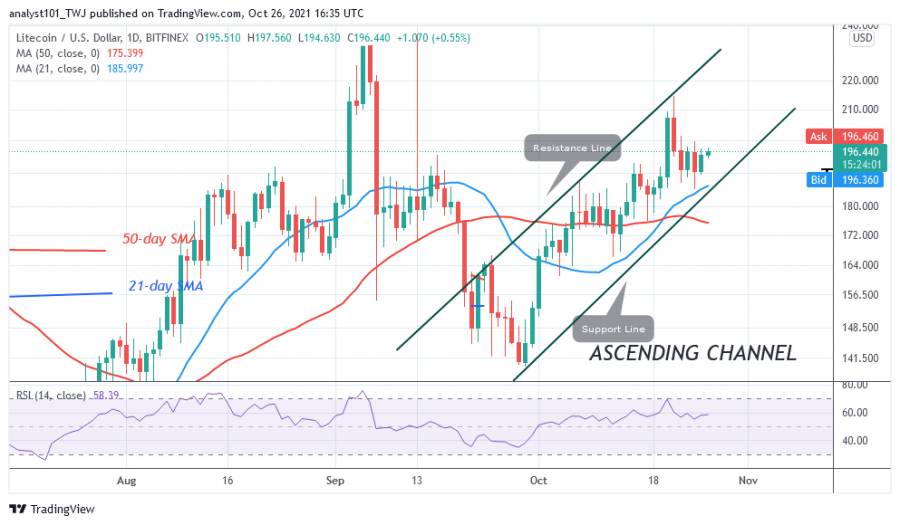
Today, Litecoin (LTC) is pushing higher and retesting the $210 resistance level. On October 21, buyers tried to reach the previous high of $230 but were beaten back.
The cryptocurrency fell and found support above $190. In the past week, the LTC price has been fluctuating above the current support for a possible upside move. If buyers manage to keep the LTC price above the $210 resistance, the market will rise to the previous high of $230. However, the upside correction above the moving averages will continue if the resistance is not broken.
Litecoin indicator analysis
Litecoin has risen to level 58 on the Relative Strength Index for period 14. The cryptocurrency is trading in the bullish trend zone and is capable of further upward movement. Litecoin is above 70% of the daily stochastic. This indicates that the altcoin is in a bullish momentum.

Technical indicators
Resistance Levels: $200, $220, $240
Support Levels: $160, $140, $120
What is the next move for Litecoin?
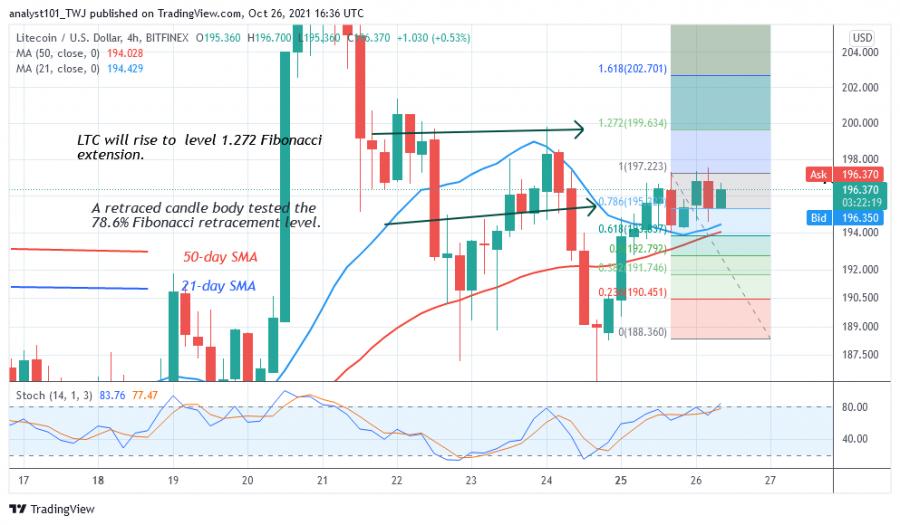
On the 4-hour chart, Litecoin is in an uptrend, but it is rejected at the high of $210. Since October 21, the altcoin has been forced to move sideways. Meanwhile, the uptrend from October 26 has a candlestick testing the 78.6% Fibonacci retracement level. The retracement suggests that LTC will rise but reverse at the 1,272 Fibonacci extension level or the $199.49 level.

Disclaimer. This analysis and forecast are the personal opinions of the author and are not a recommendation to buy or sell cryptocurrency and should not be viewed as an endorsement by CoinIdol. Readers should do their own research before investing funds.
News
Price
News
Price
Price

(0 comments)