Litecoin Stays Above $84 As Traders Show Apathy

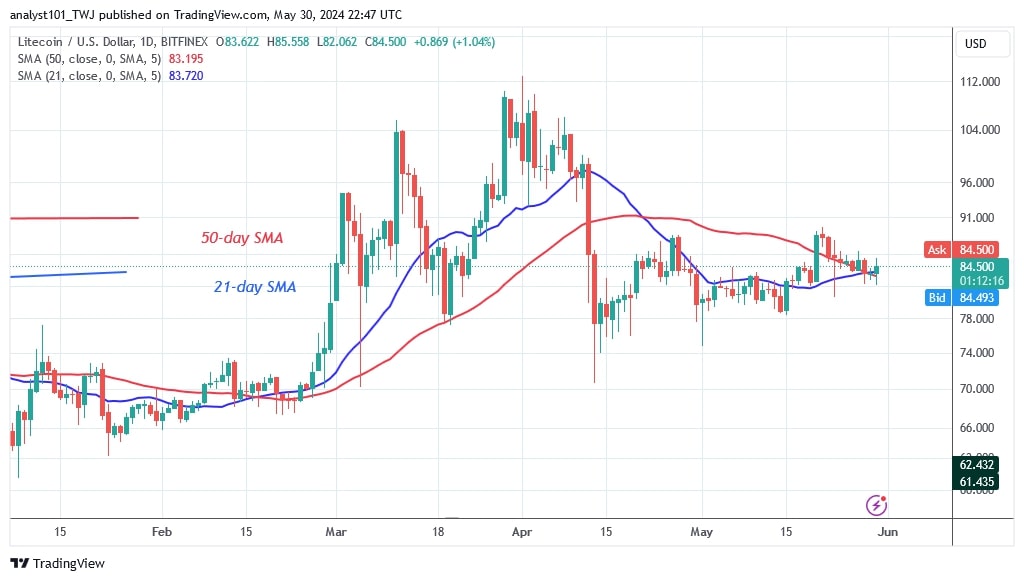
Litecoin's (LTC) price has not fallen below the 50-day SMA support despite being rejected at its high of $89.
Long-term Litecoin price prediction: fluctuating
On May 23, the bears broke below the moving average lines, but the bulls bought the dips. Doji candlesticks formed, bringing the price of the cryptocurrency back above the 50-day SMA. Today, as Coinidol.com reports, the price of the cryptocurrency has risen slightly above the 50-day SMA support.
On the upside, Litecoin is set to test its previous high of $89. If the current resistance is broken, the positive momentum will continue to the high of $100. However, Litecoin will return to its trading range if the bulls fall below the moving average lines. Litecoin will then fall to its current support of $79. Meanwhile, the altcoin is valued at $84 at the time of writing.
Analysis of the Litecoin indicators
The LTC price bars are above the 50-day SMA support. The Doji candlesticks have limited the overall price movement of the coin. The price has been holding above the moving average lines. This is due to the fact that traders are not concerned about the direction of the market.
Technical Indicators
Resistance levels: $100, $120, $140
Support levels: $60, $40, $20

What's next for Litecoin?
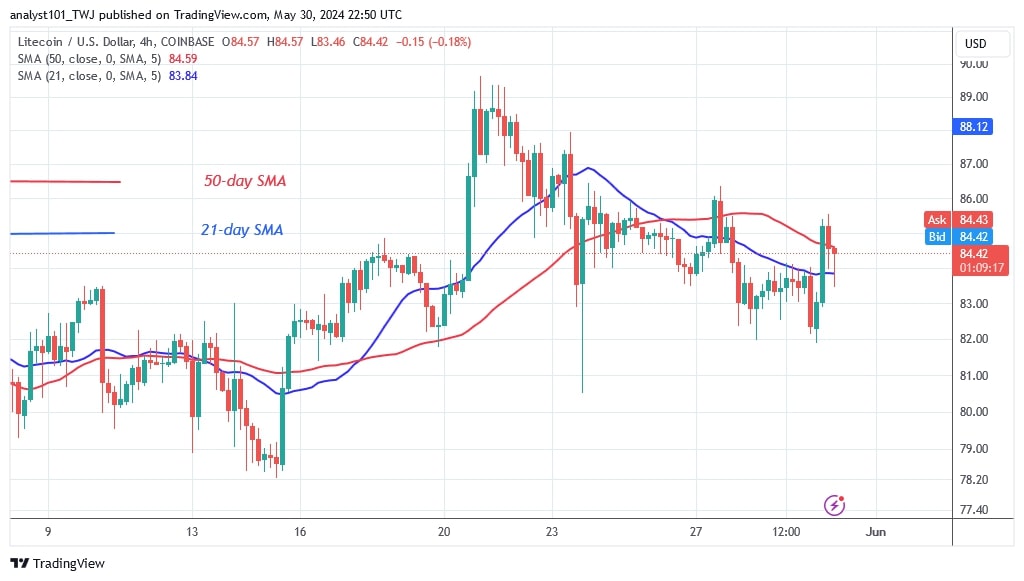
On the four-hour chart, Litecoin has fallen below the moving average lines. The price of the crypto asset is fluctuating between the moving average lines, which has reduced selling pressure. Coins tend to trend when moving averages are broken. There are doji candlesticks that mitigate price fluctuations.

Disclaimer. This analysis and forecast are the personal opinions of the author and are not a recommendation to buy or sell cryptocurrency and should not be viewed as an endorsement by CoinIdol.com. Readers should do their research before investing in funds.
Price
Price
News
Price
Price

(0 comments)