Litecoin Maintains Its Horizontal Trend And Stays Above $61
Updated: Oct 18, 2023 at 12:04

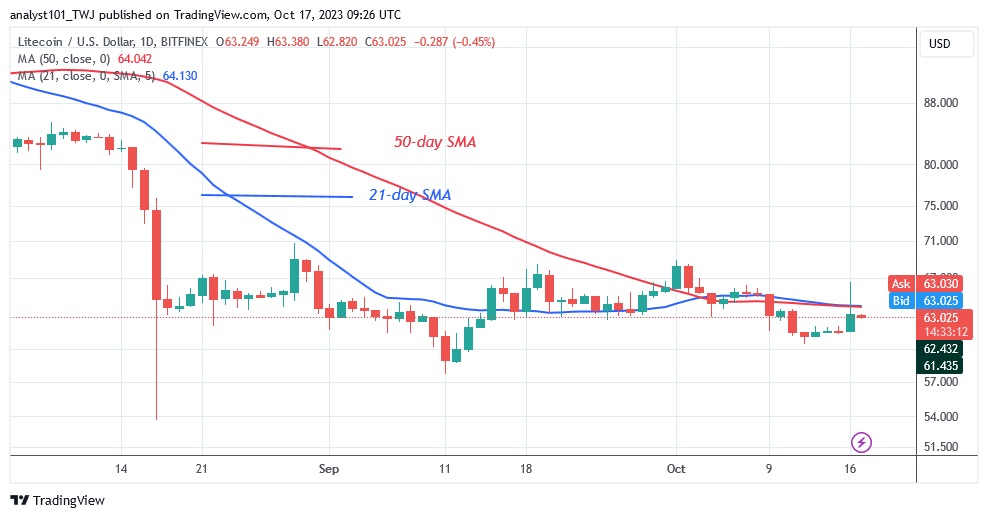
Cryptocurrency price analysis brought by Coinidol.com. Litecoin (LTC) has maintained its sideways movement between $61 and $68. This price range has not changed since August 17.
Long-term forecast of Litecoin price: fluctuation range
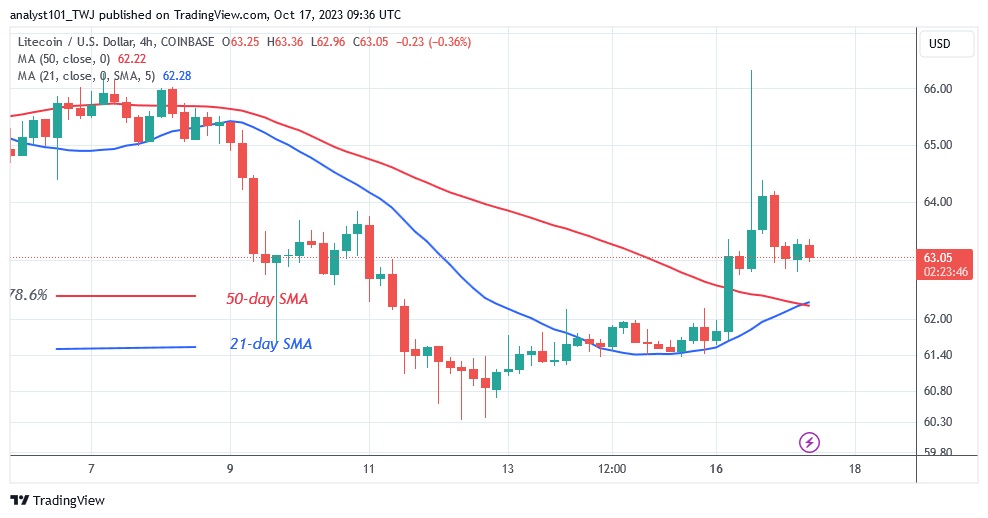
Litecoin has declined in the last week, reaching a low of $60 on October 12. The cryptocurrency's price consolidated above the current support level before recovering.
The altcoin rose above the moving average lines and reached a high of $66. LTC's last high was immediately rejected as it fell below the moving average lines. At the time of writing, the crypto asset is valued at $63. In the meantime, the horizontal trend might persist due to the presence of doji candlesticks.
Litecoin indicators analysis
The moving average lines have dipped into the horizontal since October 4. The price bars are converging above the current support while remaining below the moving average lines. Doji candlesticks are present, causing the LTC price to stagnate. The cryptocurrency is trading within a limited range.

Technical indicators
Resistance levels: $100, $120, $140
Support levels: $60, $40, $20
What is the next move for Litecoin?
LTC/USD will continue to trade horizontally until the boundaries of the trading range are broken. The extended candle from October 16 indicates strong short-term selling pressure at higher price levels. The uptrend is limited to $64.

As we reported on October 10, Litecoin was dumped on October 2 at a high of $68 as buyers failed to maintain upward momentum above the $68 resistance level. The price decline is expected to accelerate when the altcoin falls below the moving average lines.
Disclaimer. This analysis and forecast are the personal opinions of the author and are not a recommendation to buy or sell cryptocurrency and should not be viewed as an endorsement by CoinIdol.com. Readers should do their research before investing in funds.
Price
News
Price
Price
Price

(0 comments)