Litecoin Moves Sideways And Fights Resistance At $80
Updated: Dec 14, 2022 at 15:23

Litecoin (LTC) has been moving upwards since November 23. The high at $84 has slowed down the upward movement.
Long-term forecast for Litecoin price: Bullish
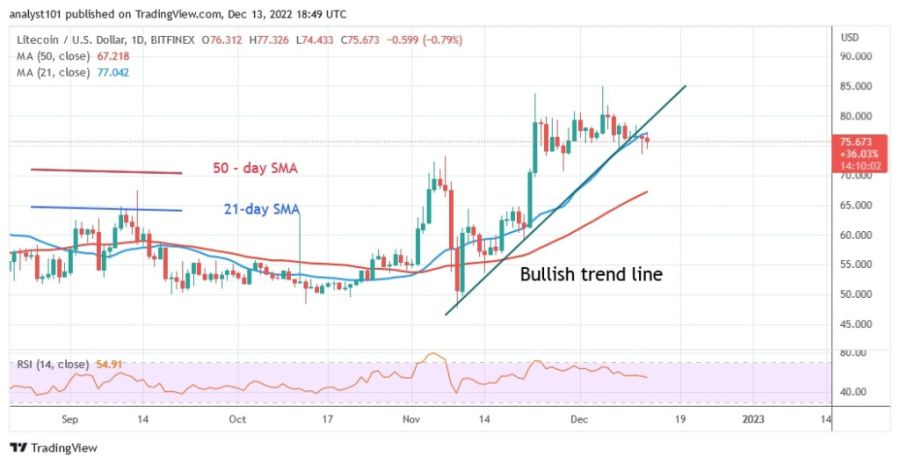
The altcoin has bounced below the last high in recent weeks. In other words, the price has been fluctuating between $70 and $84, with Litecoin remaining comparatively steady. Since the termination of the uptrend, buyers have protected the $70 support. On the positive side, the market is approaching the overbought zone, so further upward movement seems unlikely. On the downside, the cryptocurrency could fall if sellers drop below the current support or moving average lines. At the time of writing, Litecoin's price is at $76.51.
Litecoin Indicator Analysis
Litecoin is moving sideways, reaching level 56 of the Relative Strength Index for period 14. After a short correction, the altcoin is now trading in the bullish trend zone. The price bars are above the moving average lines, which indicates that the cryptocurrencies value might increase. The cryptocurrency is moving above level 50 in a positive trend upwards.
Technical indicators
Resistance levels: $140, $180, $220
Support levels: $100, $60, $20

What is the next move for Litecoin?
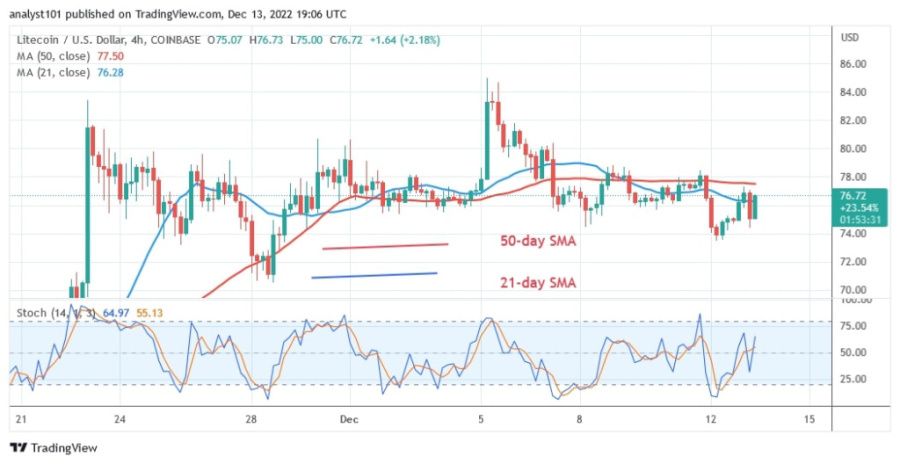
LTC/USD is moving sideways while the altcoin continues to trade in the zone of uptrend. The price of the cryptocurrency is between the moving average lines on the 4-hour chart. If LTC crosses the 50-day line SMA or crosses the $78 level, the uptrend will resume.

Disclaimer. This analysis and forecast are the personal opinions of the author and are not a recommendation to buy or sell cryptocurrency and should not be viewed as an endorsement by CoinIdol. Readers should do their own research before investing in funds.
News
Price
Price
News
Price

(0 comments)