Litecoin Risks Further Decline as Price Hovers Above the Critical Support at $51

For the past week, Litecoin has been in a downward move after failing to break the $60 resistance. In the first rejection, the coin fell to a low at $55.20 as bulls bought the dips.
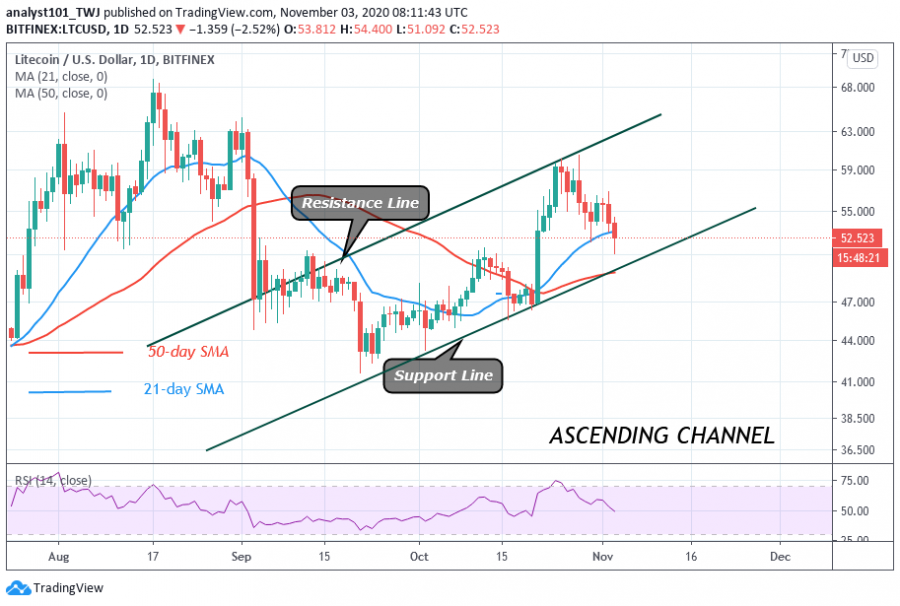
On October 28, buyers retested the resistance at $60 which compounded the downward move. Eventually, LTC dropped to $51 low and corrected upward. Nevertheless, the coin will sink further once the price breaks below the $51 support. The $51 support level is the price level where the crypto resumes the upside momentum. Meanwhile, Litecoin is trading at $52 at the time of writing.
Litecoin indicator analysis
The price has broken the 21-day SMA but not convincingly. However, if the price breaks below the simple moving averages, it indicates that the coin is likely to fall. The coin is at level 50 of the Relative Strength Index period 14. This indicates that there is a balance between supply and demand.

Key Resistance levels: $80, $100, $120
Key Support levels: $50, $40, $20
What is the next move for Litecoin?
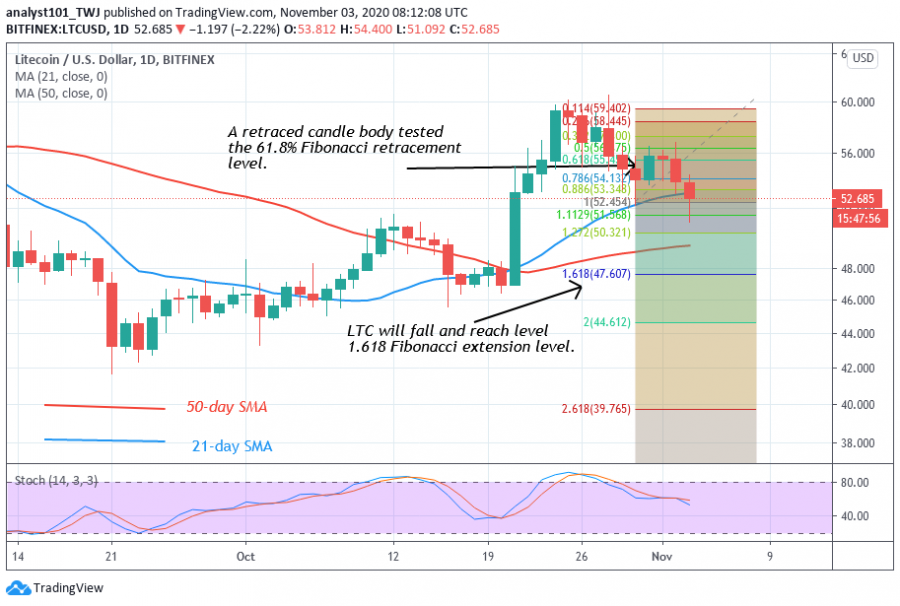
On October 31, Litecoin retested the $60 resistance zone. This resulted in a further downward movement of the coin. It is unclear the extent of the selling pressure. On the October 30 downtrend, the coin was resisted. The retraced candle body tested the 61.8 % Fibonacci retracement level. This implies that the coin will fall to level 1.618 Fibonacci extensions. That is a low of $47.

Disclaimer. This analysis and forecast are the personal opinions of the author that are not a recommendation to buy or sell cryptocurrency and should not be viewed as an endorsement by CoinIdol. Readers should do their own research before investing funds.
Price
Price
Price
News
Price

(0 comments)