Litecoin Price Pulls Back And Faces First Resistance At $68
Updated: Jan 09, 2024 at 13:50

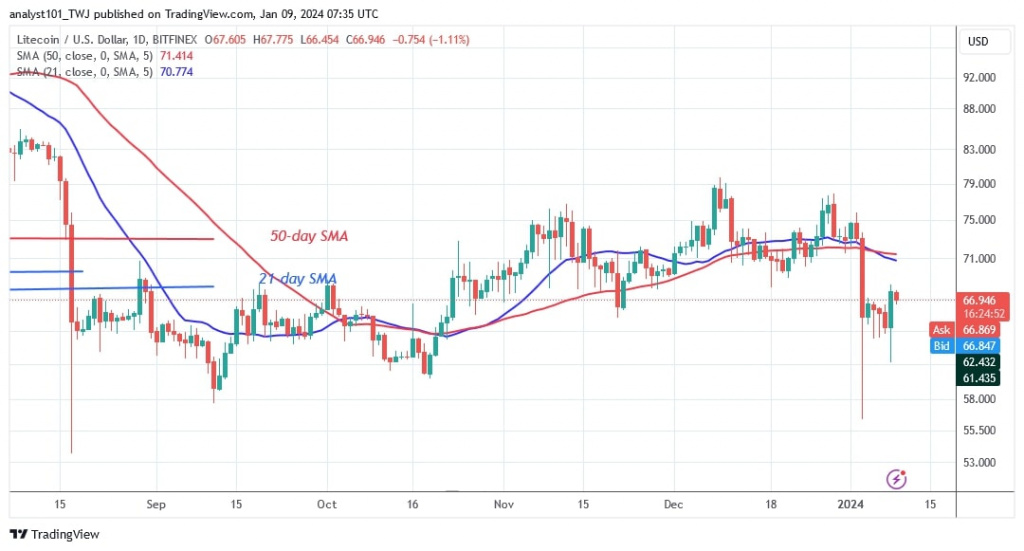
The price of Litecoin (LTC) has fallen below the moving average lines, but consolidation has continued above the $64 support level.
Long-term outlook for the Litecoin price: bearish
According to the analysis by Coinidol.com, the price of the altcoin fell to $56 during the price drop on January 3, but the bulls bought the dips. The altcoin continues to rise today after climbing back above $64. The high of $68 serves as the first resistance for the upside momentum. After the initial barrier at $68, the cryptocurrency is bearish.
On the downside, the altcoin will fall and retrace its steps to the previous low at $56 should the sellers breach the existing support.
However, should the current support hold, Litecoin will be forced to move between $64 and $71. In the meantime, Litecoin pulls back towards its current support.
Analysing the Litecoin indicators
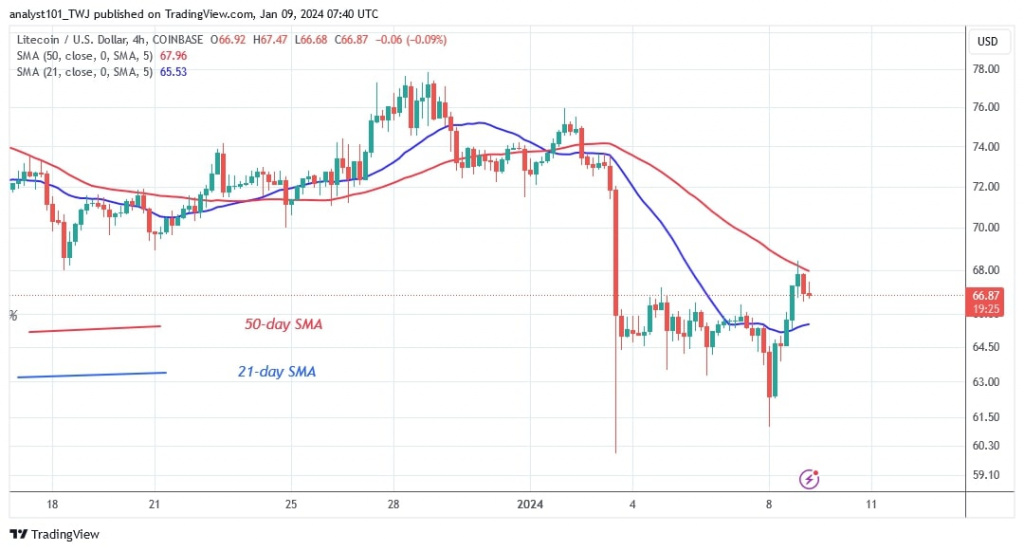
Although the price of LTC is below the moving average lines, indicating a further decline, the market has already reached bearish exhaustion. At the moment, the price bars of the 4-hour chart are between the moving average lines. This indicates that the cryptocurrency may fluctuate.
Technical indicators
Resistance levels: $100, $120, $140
Support levels: $60, $40, $20

What's the next move for Litecoin
Litecoin has slid all the way down the chart. The value of the digital asset has fallen to $56, close to the $53 breakout on August 17, 2023. The altcoin is making a comeback today as it holds above the $64 support level. The longer candlestick tails at the bottom of the chart indicate strong buying pressure at lower prices.

Previously Coinidol.com reported that Litecoin price was in the positive trend zone since the breakout on December 26.
Disclaimer. This analysis and forecast are the personal opinions of the author and are not a recommendation to buy or sell cryptocurrency and should not be viewed as an endorsement by CoinIdol.com. Readers should do the research before investing in funds.
Price
News
Price
Price
Price

(0 comments)