Litecoin Price Continues Rising After Breaking Above $70

The current uptrend will continue as the price bars are above the moving average lines.
Long-term forecast for the Litecoin price: bullish
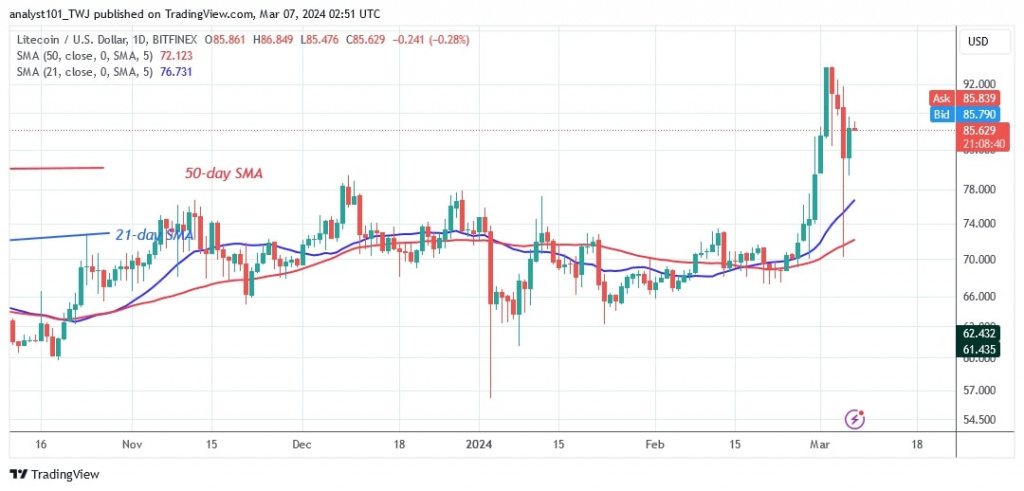
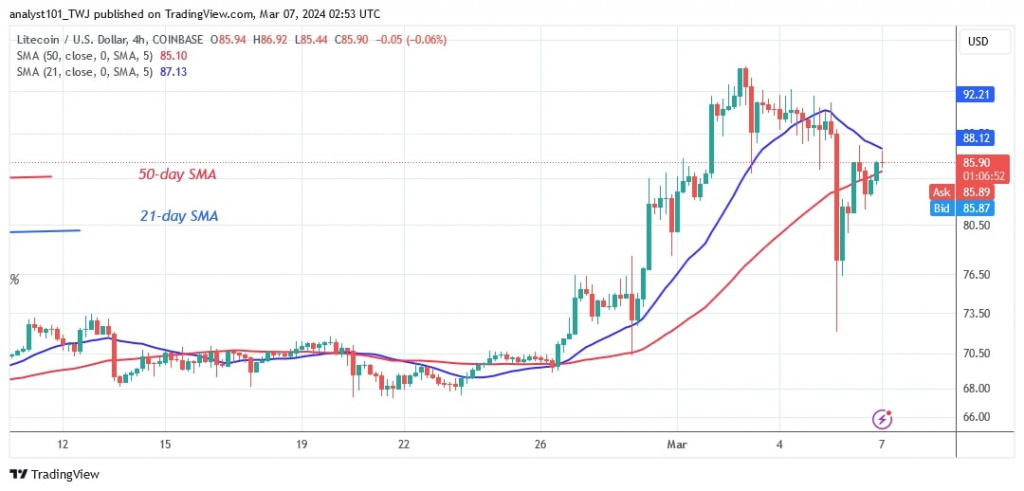
Litecoin (LTC) has fallen above the moving averages after a strong rise on March 2. The uptrend reached a high of $94.50 but was halted. The altcoin is currently recovering from its previous decline. Litecoin quickly fell to a low of over $70, but immediately recovered back above the moving average lines. The current LTC price is $85.79.
Should buyers break through resistance at $94.50, the altcoin could reach a high of $122. In the meantime, LTC price remains in a trading range, hovering above the 21-day SMA and resistance at $94.
Analysis of the Litecoin indicators
The LTC price bars are currently above the moving average lines, even though they had previously dipped below them. On the 4-hour chart, the price of the cryptocurrency is trapped between the moving average lines. This causes the cryptocurrency to move in a trading range. The long candle tails on both charts indicate strong buying pressure at lower prices.
Technical indicators
Resistance levels: $100, $120, $140
Support levels: $60, $40, $20

What's next for Litecoin?
Litecoin is intact as the price bars have risen above the moving average lines. The altcoin is trading between support at $76.50 and resistance at $95. The upward correction will continue if the altcoin breaks through the resistance at the recent high. Otherwise, the movement will remain within the defined range.

Disclaimer. This analysis and forecast are the personal opinions of the author and are not a recommendation to buy or sell cryptocurrency and should not be viewed as an endorsement by CoinIdol.com. Readers should do their research before investing in funds.
Price
Price
News
Price
Price

(0 comments)