Litecoin Bounces Back But Encounters Resistance At $83

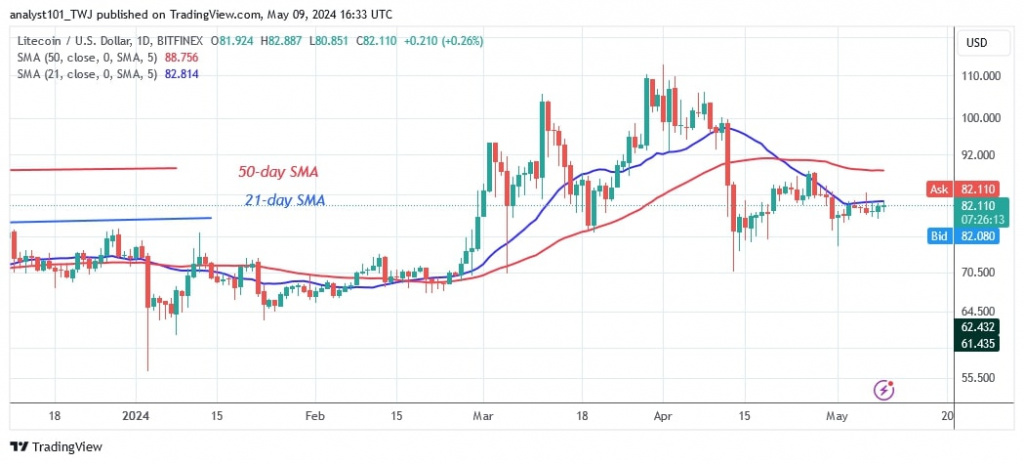
The price of Litecoin (LTC) bounces above the current support at $73 but remains below the moving average lines.
Long-term outlook for Litecoin price: bearish
The altcoin corrected higher but was rejected twice by the 21-day SMA. The upside is further limited by the 21-day SMA or resistance at $83. The cryptocurrency is currently trading below the 21-day SMA resistance but above the support at $73. The altcoin appears to be trading in a limited range, which could lead to a price breakout or crash. Litecoin is currently worth $83.
Litecoin indicator analysis
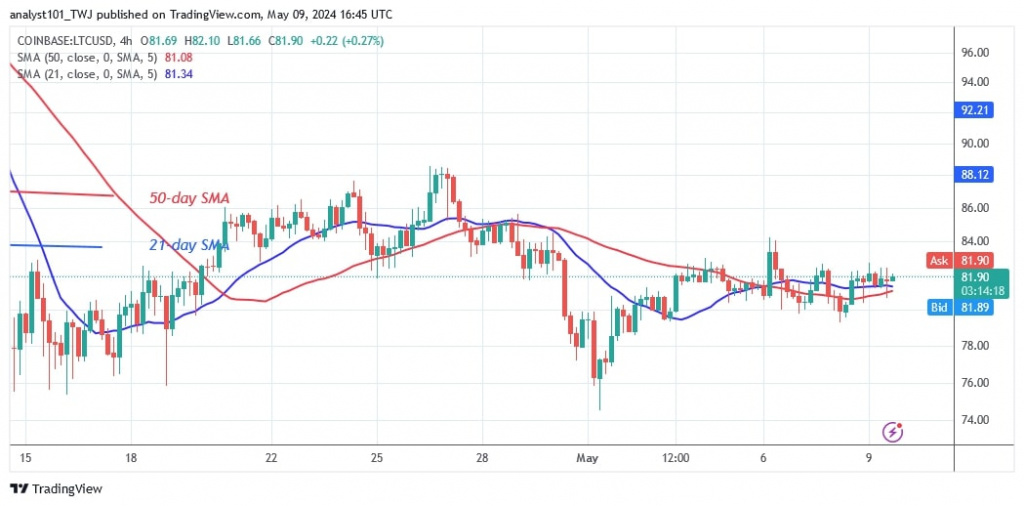
The 4-hour chart shows price bars above the sloping moving average lines, indicating a sideways trend. The price bars are limited and dominated by doji candlesticks. Long candlestick tails point to the current support at $73.
Technical indicators
Resistance levels: $100, $120, $140
Support levels: $60, $40, $20

What's the next move for Litecoin
Litecoin is trading below the 21-day SMA but above the $73 support. Price action has remained stable due to doji candlesticks. Since March 5, the bulls have defended the current support of $73. Once the price of the cryptocurrency breaks above the moving average lines, it will resume its uptrend.

Disclaimer. This analysis and forecast are the personal opinions of the author and are not a recommendation to buy or sell cryptocurrency and should not be viewed as an endorsement by CoinIdol.com. Readers should do their research before investing in funds.
Price
Price
News
Price
Price

(0 comments)