Litecoin Resumes Upward Move After Forming a Bearish Double Top

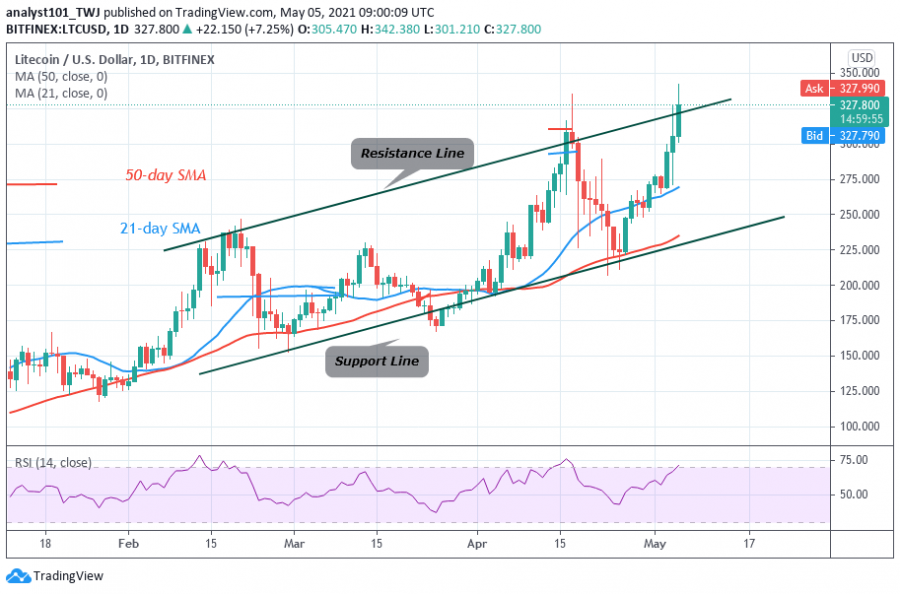
Litecoin has rallied and retested $340 overhead resistance after a price tussle at $300 minor resistance. In the first week of May, Litecoin bulls made their third attempt at the $300 resistance level.
On their first attempt at the resistance, the LTC price fell to the low of $288. Nevertheless, LTC /USD dropped sharply to $272 low as the altcoin formed a bearish double top pattern while attempting to break the resistance the second time.
Expectantly, the bulls bought the dips as price resumed moving upward. The altcoin upward move is likely because the LTC price is above the moving averages. Today, the bulls have broken the resistance and made a pullback. The pullback retested the $300 support as price rallied to $340 high. LTC/USD is facing resistance at $340 after the recent rally. The altcoin price pulled back and it is consolidating above the $320 support. Presently, Litecoin is trading at $326.49 at the time of writing
Litecoin indicator analysis
Litecoin price is above the 50-day and the 21-day SMAs which suggest a possible movement of price. The altcoin is at level 71 of the Relative Strength Index period 14. It indicates that the market is now in the uptrend zone and it is trading in the overbought region of the market.

Technical indicators:
Major Resistance Levels – $340 and $380
Major Support Levels – $200 and $160
What is the next move for Litecoin?
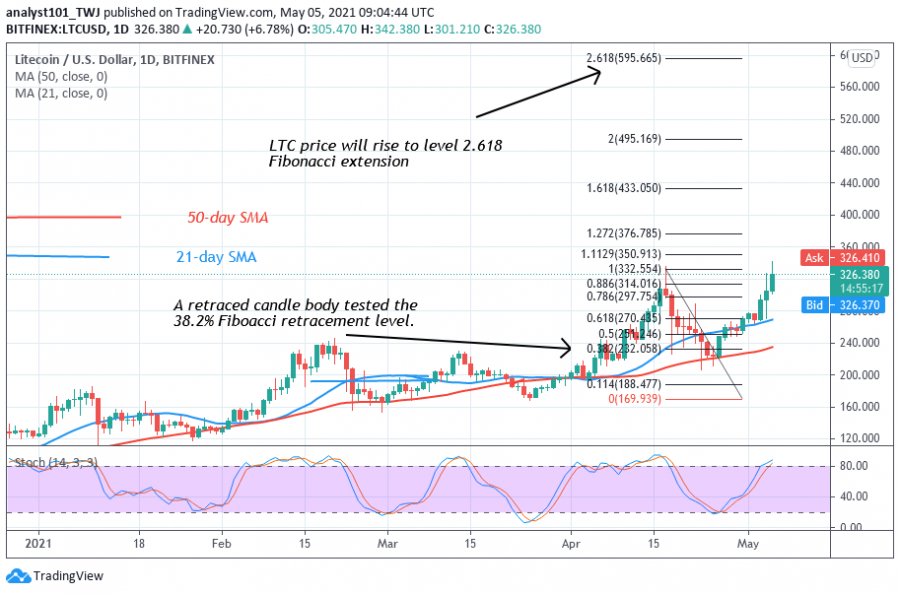
Litecoin has been rising after falling to the low of $207. The bulls have broken the resistance at $300. The price indicator has shown an upward move of Litecoin. On April 17 uptrend; a retraced candle body tested the 38.2% Fibonacci retracement level. This retracement indicates that the market will rise to level 2.618 Fibonacci extensions or the high of $595.66.

Disclaimer. This analysis and forecast are the author’s personal opinions and not a recommendation to buy or sell cryptocurrency and should not be viewed as an endorsement by CoinIdol. Readers should do their own research before investing funds.
Price
Price
Price
Price
Price

(0 comments)