Litecoin Bulls Sustain Recent Rallies but Struggle to Break $230 Resistance
Updated: Feb 19, 2021 at 12:33

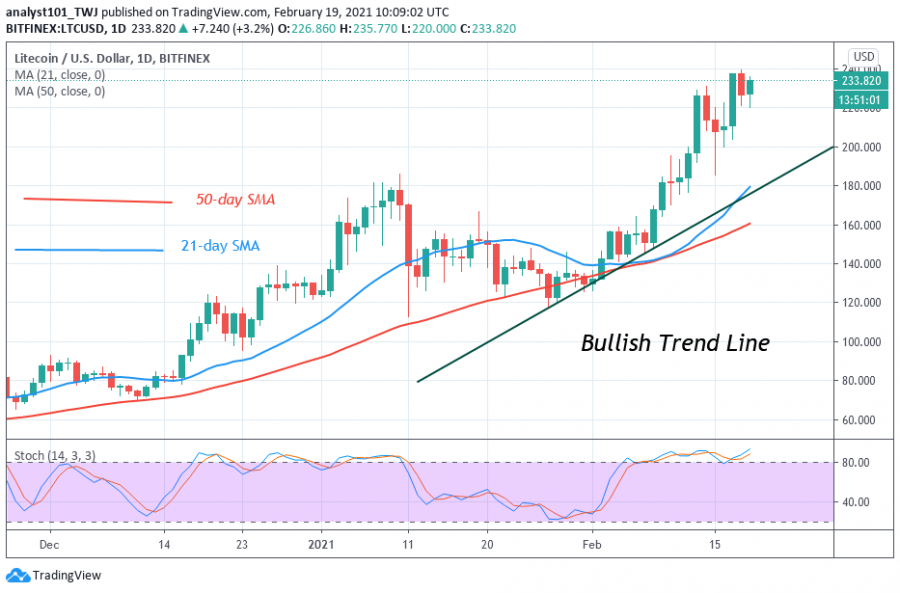
For the past week, Litecoin attained a peak price of $230 and a further upward move resulted in a downward correction. Buyers have made concerted efforts to push LTC’s price above the recent high but were repelled.
On February 14, the bulls attempted to break the resistance but the altcoin fell to a low of $185.50. The bulls were on hand as they bought the dips which propel the market to move up. The price rallied to $240 and it was subsequently repelled. Litecoin made another downward correction to $220 low. Today, the cryptocurrency is fluctuating below and above the $230 price level. There has been no significant price movement as altcoin is yet to trend. On the upside, if the bulls can break the recent high; the market will reach the highs of $250 and $270 price levels.
Litecoin indicator analysis
The price movement has been stunted because of the recent price indicators. The RSI has indicated that Litecoin is above level 70 and it has no room to rally on the upside. LTC is still in the overbought region as sellers emerge to push prices down.

Technical indicators:
Major Resistance Levels – $240 and $260
Major Support Levels – $160 and $140
What is the next move for Litecoin?
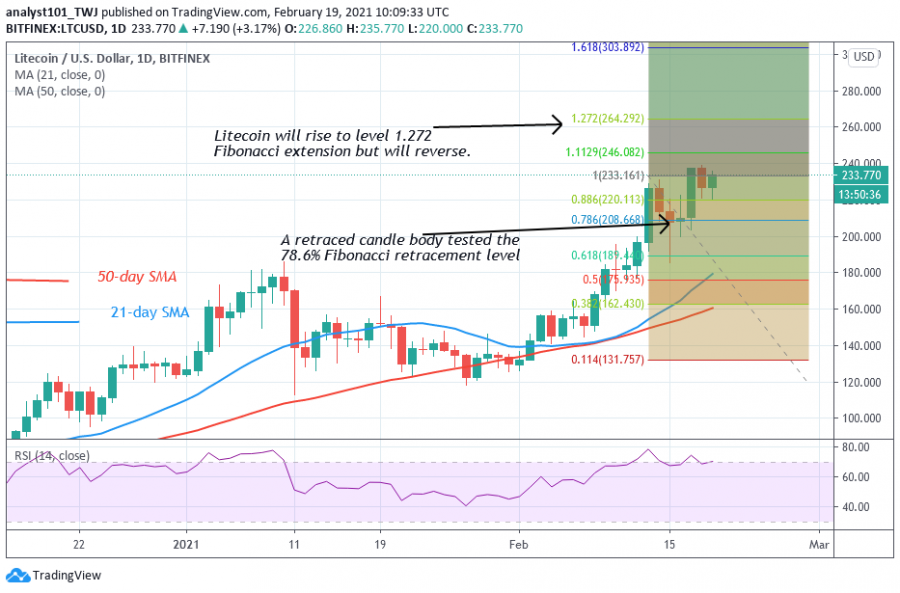
Litecoin has been in a downward correction. The bulls are yet to break the current resistance. The Fibonacci tool has indicated a possible move on the upside and reversal. On February 14 uptrend; a retraced candle body tested the 78.6% Fibonacci retracement level. This retracement indicates that LTC will rise to level 1.272 Fibonacci extension level or a high of $264.29. However, there is a possibility that the market will reverse to a 78.6% Fibonacci retracement level.

Disclaimer. This analysis and forecast are the personal opinions of the author that are not a recommendation to buy or sell cryptocurrency and should not be viewed as an endorsement by CoinIdol. Readers should do their own research before investing funds.
News
Price
Price
News
Price

(0 comments)