Litecoin in Brief Uptrend, Attempts to Break $200 Resistance Zone
Updated: Mar 09, 2021 at 13:30

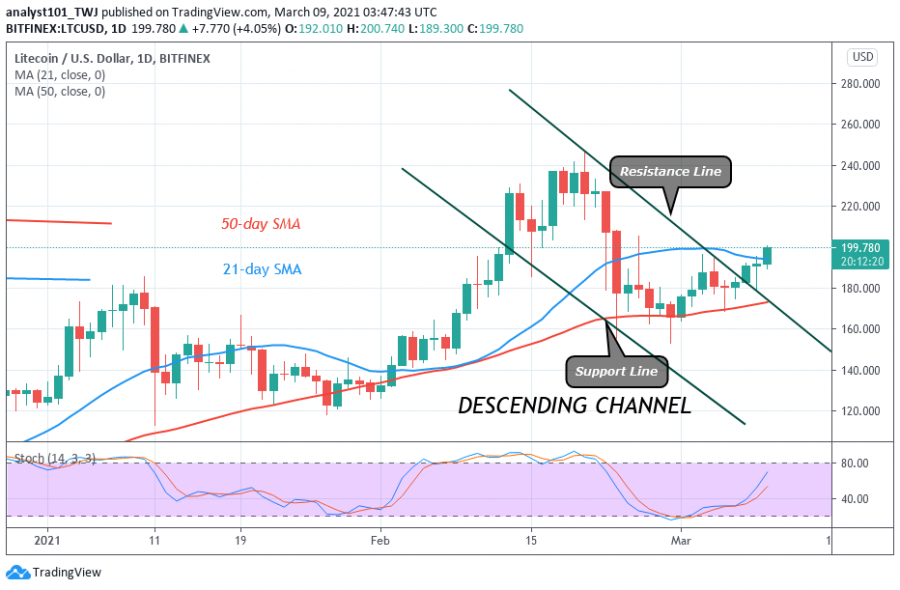
Today, buyers have retested the resistance zone twice and found penetration difficult. This bullish scenario has been ongoing after the February 23 breakdown.
On February 25, the price corrected upward but was repelled at the $205 resistance. The bearish reaction compelled Litecoin to decline to $162 low.
The uptrend repeated itself twice in March but buyers are yet to have the upper hand over sellers. The LTC price is trading at $199.68 at the time of writing. On the upside, if buyers continue to push price and the resistance is breached, LTC will retest its previous high at a level of $240. However, the bullish scenario will be invalidated if Litecoin is repelled from the $200 resistance zone. The price will then be fluctuating between $155 and $205.
Litecoin indicator analysis
LTC price is now above the 50-day and 21-day SMAs. The market will begin to rise if the current bullish momentum is sustained above the SMAs. The price is above the 40% range of the daily stochastic. This implies that Litecoin has bullish momentum.
Technical indicators:
Major Resistance Levels – $240 and $260
Major Support Levels – $160 and $140

What is the next move for Litecoin?
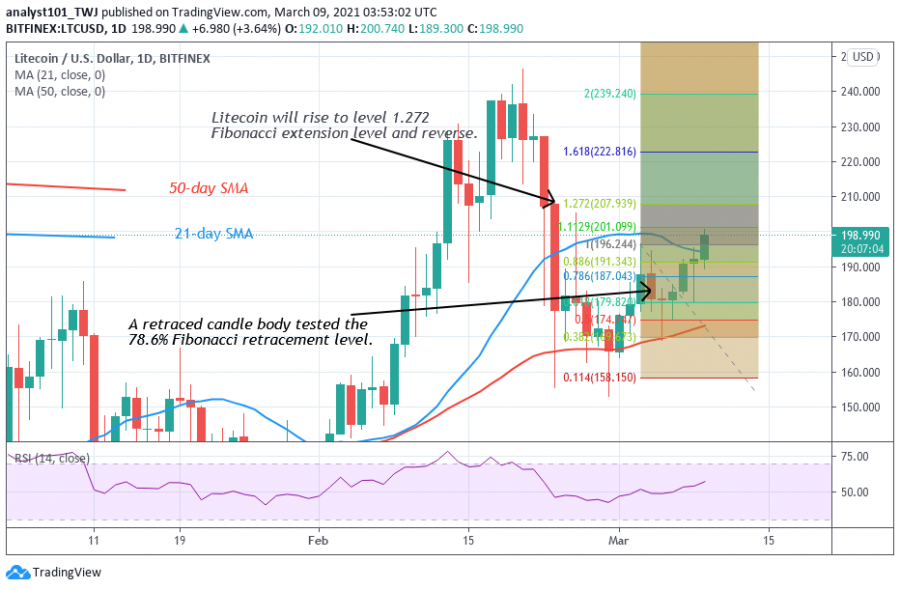
Presently, Litecoin is making an upward move. According to the Fibonacci tool, the uptrend is likely to be short-lived. On March 3 uptrend; a retraced candle body tested the 78.6% Fibonacci retracement level. This retracement indicates that LTC will rise and reverse at level 1.272 Fibonacci extension or a high of $207.93. However, the LTC price will reverse to 78.6 Fibonacci retracement level where it originated.

Disclaimer. This analysis and forecast are the personal opinions of the author and not a recommendation to buy or sell cryptocurrency and should not be viewed as an endorsement by CoinIdol. Readers should do their own research before investing funds.
Price
Price
Politics
Price
Price

(0 comments)