Ethereum Holds Above $3,000 As Traders Dispute The Market Trend
Updated: Apr 19, 2024 at 20:55

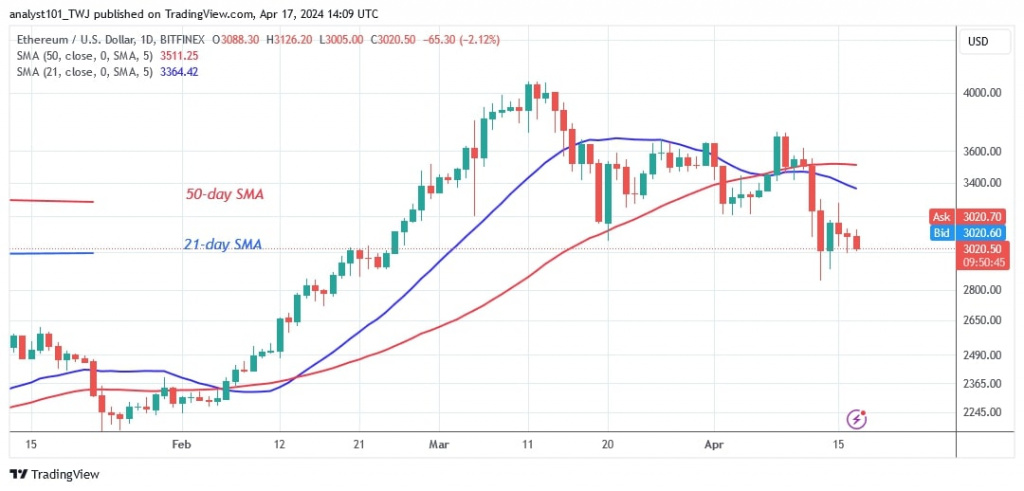
The price of Ethereum (ETH) has fallen below the moving average lines but remains above the $3,000 support.
Long-term analysis of the Ethereum price: bearish
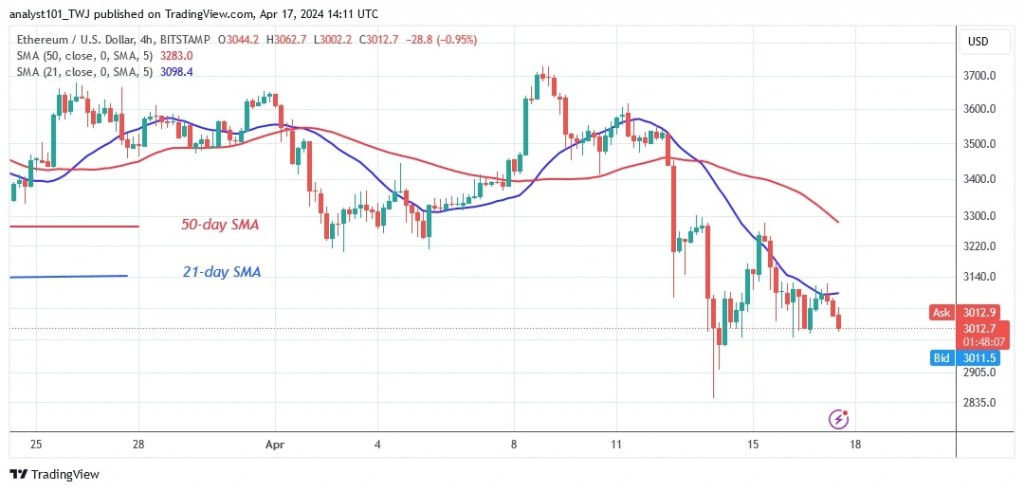
Since the price drop on April 13, 2024, the largest altcoin has been trading above the $2,800 support but below the moving average lines or resistance at $3,200. Bulls and bears are at odds over the direction of the market.
On April 13, the bears planned to dump Ether when it fell to a low of $2,848. Ether would have fallen to a low of $2,700. Nevertheless, the bulls bought the dips and pushed Ether above the $3,000 support level. ETH/USD is currently worth $3,020.
Analysis of the Ethereum indicators
Ether's price bars are below both the 21-day and 50-day SMA, with the 21-day SMA acting as resistance. The altcoin will regain its bullish momentum if the bulls break above the 21-day SMA. The emergence of Dojt candlesticks has led to a marginal price movement.
Technical indicators:
Key resistance levels – $4,000 and $4,500
Key support levels – $3,500 and $3,000

What is the next direction for Ethereum?
The largest altcoin is in a downtrend but fluctuating within a range. The downtrend has weakened and Ether is trading between $2,800 and $3,600. However, the upward movement continues to be hindered by resistance at $3,200. The 21-day simple moving average has narrowed the current price range.

Disclaimer. This analysis and forecast are the personal opinions of the author and are not a recommendation to buy or sell cryptocurrency and should not be viewed as an endorsement by CoinIdol.com. Readers should do their research before investing in funds.
Price
Price
News
Price
Price

(0 comments)