Ethereum Price Range Continues And Bounces Off The $3,100 Support Level
Updated: Apr 26, 2024 at 10:41

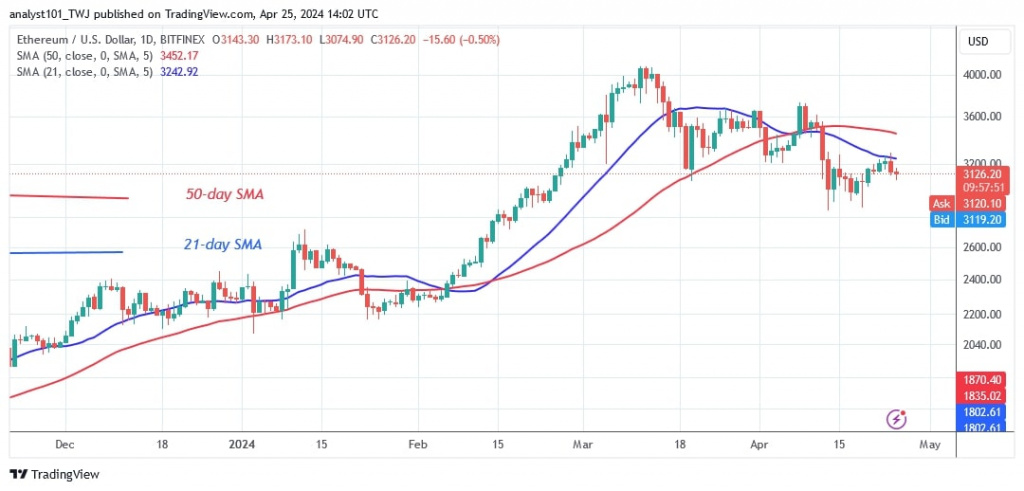
The price of Ethereum (ETH) is bearish after bouncing off the 21-day SMA or resistance at $3,200. Price aa
Long-term analysis of Ethereum price: bearish
The largest altcoin was in an upward correction and rallied to the 21-day SMA or resistance at $3,200. The 50-day SMA would have also been the target of the upside momentum if the 21-day SMA barrier was breached. Ether crashed after the rejection at the moving average lines. The altcoin is currently trading at $3,132.
On the downside, Ether is expected to fall to the current support of $2,908 or the psychological price of $3,000. Should Ether fall, the bulls will try to defend the current support of $2,908. During the price drop on April 13, the bulls bought the dips when Ether hit a low of $2,848. Later, the price decline was halted above $2,908 as Ether regained positive momentum.
Analysis of the Ethereum indicators
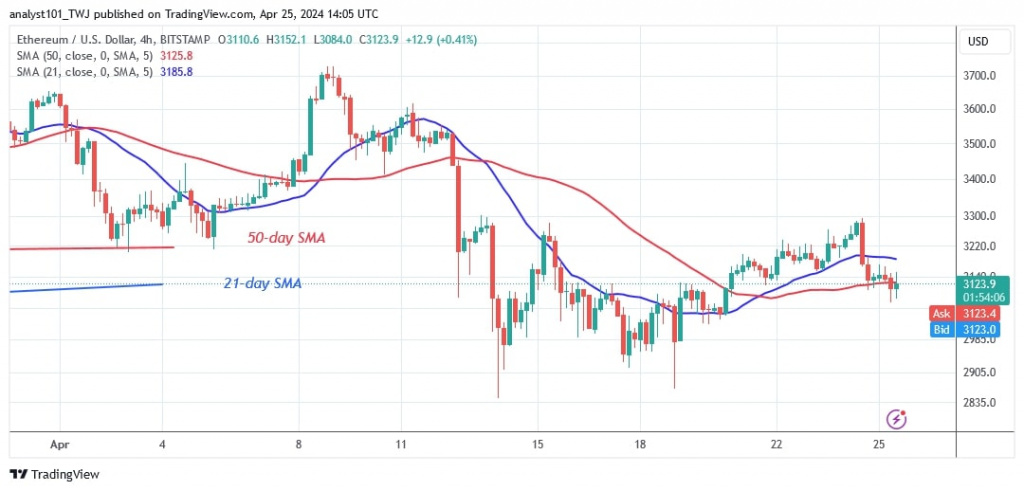
Ether's price bars have fallen below the moving average lines during the recent decline. The 4-hour chart shows horizontally sloping moving average lines as a result of a downtrend. The horizontal trend is complemented by doji candlesticks, which limit the price movement.
Technical indicators:
Key resistance levels – $4,000 and $4,500
Key support levels – $3,500 and $3,000

What is the next direction for Ethereum?
On the 4-hour chart, Ether price is consolidating above the $2,900 support, but its upside is hindered by the $3,300 resistance level. Ether is currently trading in the middle of its price range after being rejected at the recent high. Ether's price range will continue until the current support and resistance levels are broken.

Disclaimer. This analysis and forecast are the personal opinions of the author and are not a recommendation to buy or sell cryptocurrency and should not be viewed as an endorsement by CoinIdol.com. Readers should do their research before investing in funds.
News
Price
News
Price
Price

(0 comments)