Ethereum Holds Above $1,800 And Continues Its Sideways Trend

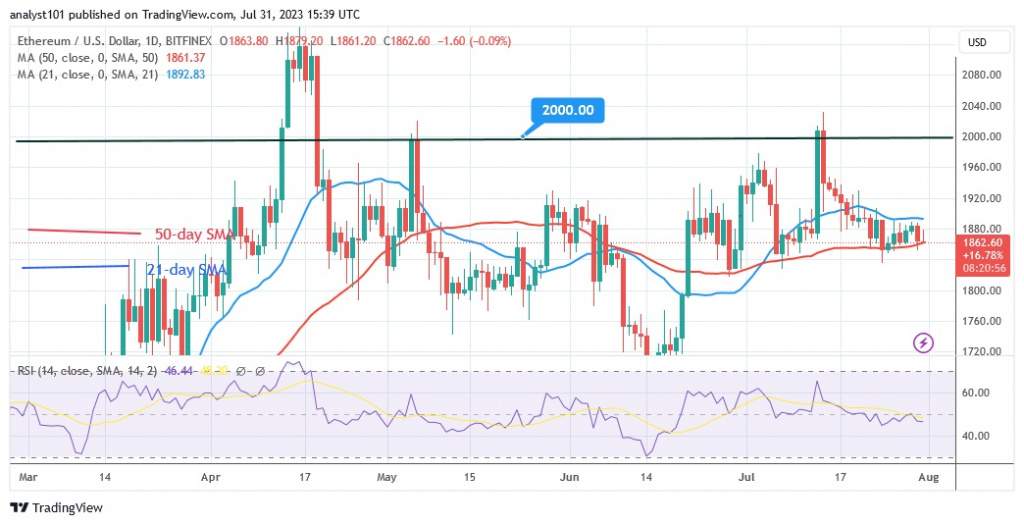
The Ethereum price (ETH) is falling as it attempts to drop below $1,800 or the 50-day simple moving average.
Long-term analysis of the Ethereum price: bearish
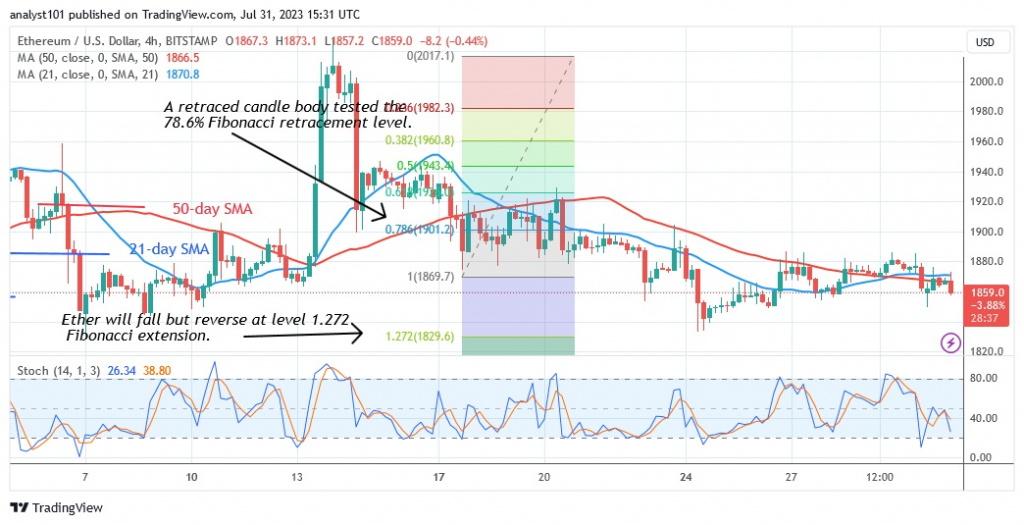
Since July 18, both bulls and bears have desperately tried to break the moving average lines, but without success. The price indicator predicts that Ether will fall to a low of $1,829 and then reverse its trend.
On July 24, the largest altcoin almost reached the Fibonacci extension before continuing its uptrend. Today, Ether is following in the footsteps of the last low. If the bears manage to break below the current support, the downtrend will resume. Ether will fall to its previous low of $1,700. If the current price of $1,800 holds, the current trend within the trading range will resume. At the time of writing, Ether is trading at $1,859.
Ethereum indicator analysis
At the 45 level of the Period 14 Relative Strength Index, Ether is in a bearish trend zone. Ether has the potential to fall further within the downtrend zone. If the price bar is trapped between the moving average lines, the altcoin will continue its path within the range. The cryptocurrency is in a downtrend momentum below the daily stochastic level of 40. The downtrend momentum is unstable due to the sideways movement of the cryptocurrency.

Technical Indicators:
Key resistance levels – $1,800 and $2,000
Key support levels – $1,600 and $1,400
What is the next direction for Ethereum?
Ethereum is under selling pressure as it approaches the $1,800 level, which serves as the current support. Earlier, the cryptocurrency tested the current support and reversed at $1,829. If the current support holds, the cryptocurrency will resume its movement within the range.

Disclaimer. This analysis and forecast are the personal opinions of the author and are not a recommendation to buy or sell cryptocurrency and should not be viewed as an endorsement by CoinIdol.com. Readers should do their research before investing in funds.
News
Coin expert
Price
Price
News

(0 comments)