Ethereum Price Wavers Before The $3,400 Level

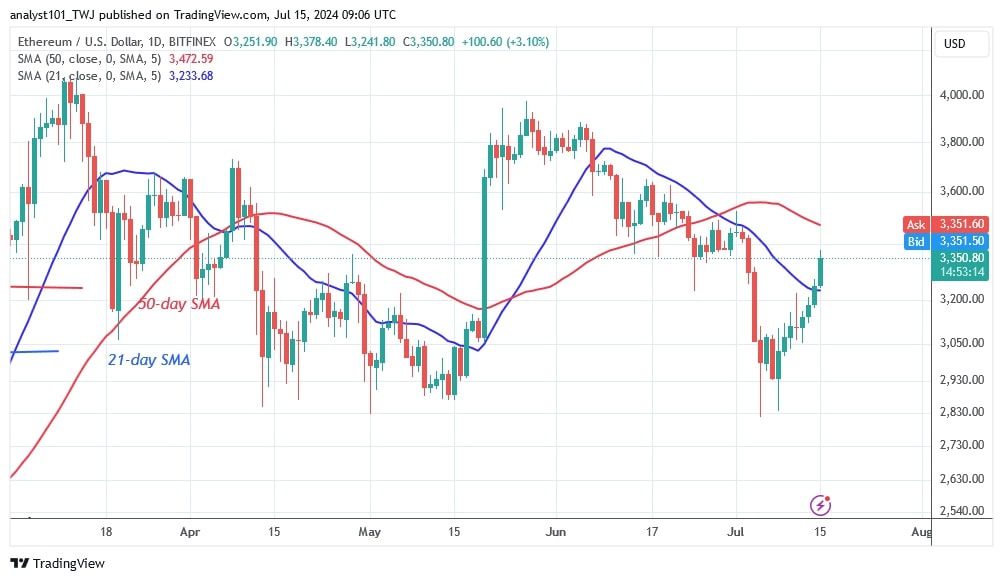
The price of Ethereum (ETH) is regaining upward momentum, breaking through the 21-day SMA and reaching a high of $3,378. Price analysis by Coinidol.com.
Long-term analysis of the Ethereum price: bearish
The bulls have dominated the bears as they broke through the resistance at the 21-day SMA. The largest altcoin will continue to rise to the 50-day SMA high or $3,500.
If the bulls break the resistance at the 50-day SMA, the altcoin will resume its uptrend. Ether will continue to rise and reach a high of $3,800. However, if the bullish momentum stalls at the 50-day SMA, Ether will be trapped between the moving average lines. The cryptocurrency is above the 21-day SMA but falls below the 50-day SMA. The value of the cryptocurrency currently stands at $346.
Ethereum indicator analysis
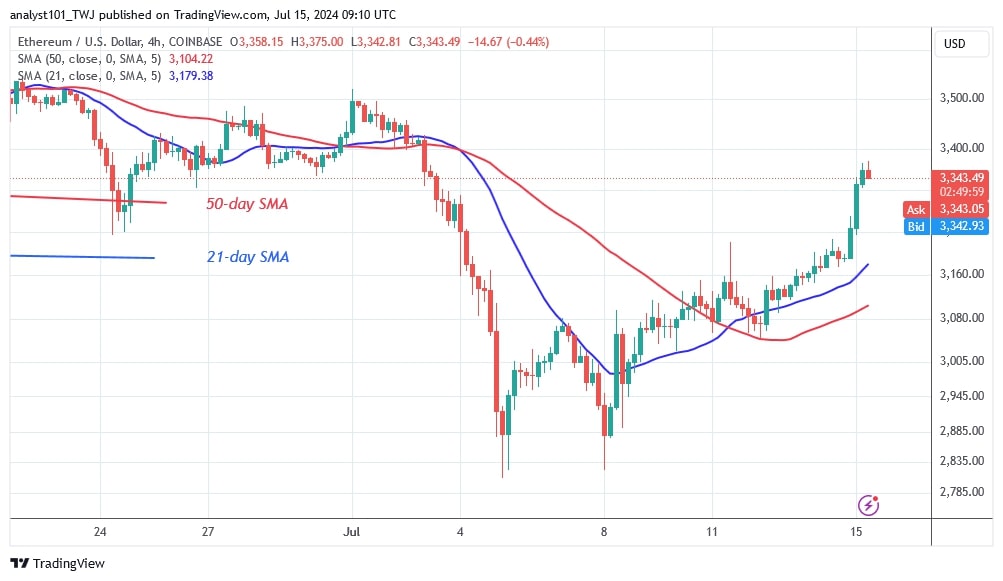
After the previous price action, Ether was trading between the moving average lines. The largest altcoin will continue to rise or fall if the moving average lines are broken. The bullish momentum has stalled between the moving average lines due to resistance at $3,400.
Technical indicators:
Key resistance levels – $4,000 and $4,500
Key support levels – $3,500 and $3,000

What's next for Ethereum?
Ethereum has recovered from its dip, although the rising momentum has been slowed by the moving average lines. Ether's direction will depend on whether it breaks through the 21-day or 50-day SMA. Ether price will be forced to fluctuate within a range for a few days.

Disclaimer. This analysis and forecast are the personal opinions of the author and are not a recommendation to buy or sell cryptocurrency and should not be viewed as an endorsement by CoinIdol.com. Readers should do their research before investing in funds.
Price
Price
News
Price
Price

(0 comments)