Ethereum Price Fears A Crash As It Fails At The $2,300 Level

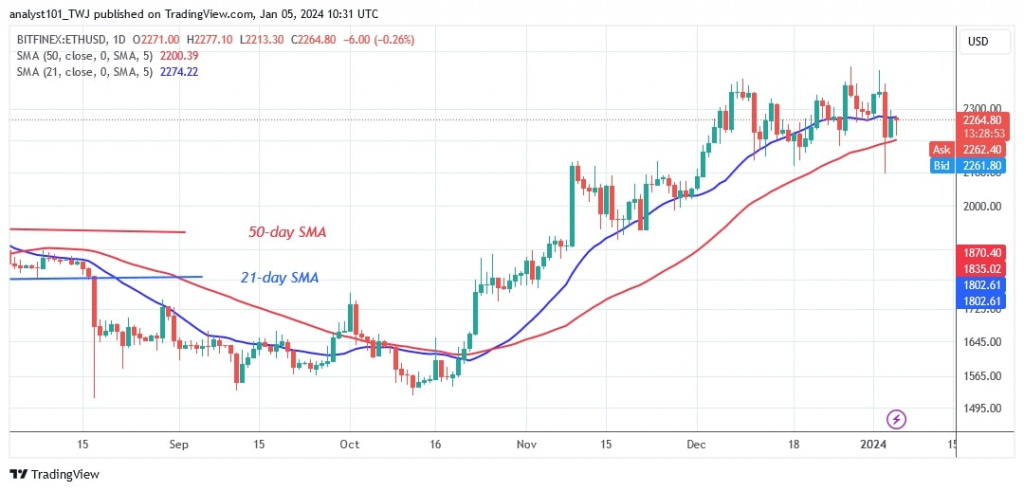
The price of Ethereum (ETH) has been trapped between moving average lines since the drop on January 3.
Long-term analysis of the Ethereum price: bullish
The largest cryptocurrency fell to a low of $2,097 on January 3, but investors bought the dips. Ether has now recovered and is currently at $2,249.50. The moving average lines have capped Ether's price movement.
If buyers manage to keep the price above the 21-day simple moving average (SMA), they may be able to resume the uptrend and reach the previous high of $2,400. However, if sellers break the 50-day simple moving average, Ether will drop to a low of $2,097. Ether price is currently oscillating between the moving average lines.
Ethereum indicator analysis
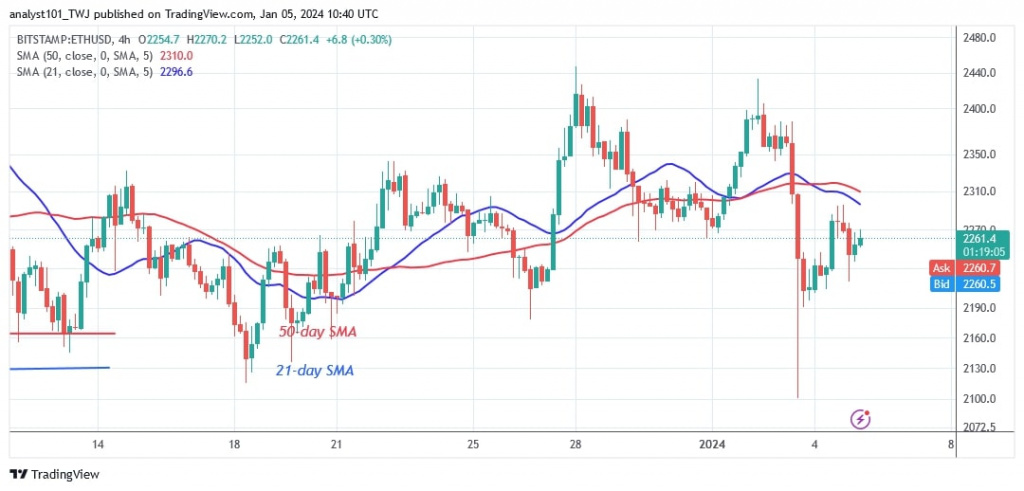
The largest cryptocurrency is currently trapped between the moving average lines due to its recent rebound. The price bars on the 4-hour chart remain below the moving average lines after the price drop on January 3. The risks for Ether are diminishing. The sideways trend below the $2,400 resistance level is the reason why the moving average lines are horizontal.
Technical indicators:
Key resistance levels – $2,200 and $2,400
Key support levels – $1,800 and $1,600

What is the next direction for Ethereum?
On the 4-hour chart, Ethereum is falling below the moving average lines. The upward correction encounters another rejection at the $2,300 level. This could push the altcoin's price above the $2,100 level and take it back to its previous low.
Coinidol.com reported on January 2 that Ether was on the rise again, reaching a high of $2,305.50. Buyers were driving Ether back to previous highs.

Disclaimer. This analysis and forecast are the personal opinions of the author and are not a recommendation to buy or sell cryptocurrency and should not be viewed as an endorsement by CoinIdol.com. Readers should do the research before investing in funds.
Price
News
Price
Price
News

(0 comments)