Ethereum Recovery Faces Stiff Resistance; Can the Bulls Sustain an Upturn?

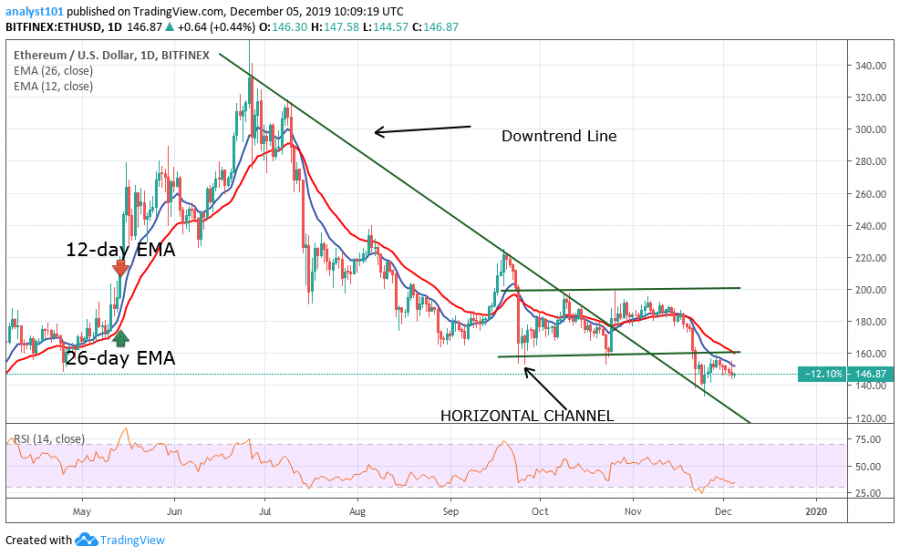
Regrettably, the pair shows no signs of recovery below the price at $150 and $160. Yesterday, the coin made a pullback and retested the price at $150 resulting in further depreciation. A retest is a confirmation that the bearish trend is ongoing. The bears have capitalized on this to sink the coin to the previous low.
At the same time, as the downward journey persists, two things may happen at the previous low of $135. Firstly, as the market pushes the price down the previous low may be broken. Possibly the market will fall and the price will find support at $120. Secondly, the buyers may come in to defend the low at $135 because it is the historical price level in March.
Ethereum Indicator Analysis
The RSI period 14 indicated that Ethereum fell beneath the centerline 50 which means it is likely to drop. The exponential moving averages are pointing southward indicating the bearish trend.

Key Supply Zones: $220, $240, $260
Key Demand Zones: $160, $140, $120
What Is the Next Move for Ethereum?
The pair is trading in a bearish market. Bears are said to be heading toward the previous low of $135. This previous low was formerly a historical price level in March where the market consolidated before an upward move to the previous highs. Ethereum may hold at this price level because the market usually respects the historical price level, except when it is broken.
Disclaimer. This analysis and forecast are the personal opinions of the author are not a recommendation to buy or sell cryptocurrency and should not be viewed as an endorsement by CoinIdol. Readers should do their own research before investing funds.
Price
Price
Price
Price
Price

(0 comments)