Ethereum in Deadlock as It Is Range-Bound between $370 and $395

Ethereum (ETH) price analysis. October 15, 2020. Following the recent impressive moves by the bulls, buyers are yet to break the $380 and $390 resistances convincingly. This is because sellers have been unrelenting to defend these levels.
Ethereum Price Long-Term Analysis: Bullish
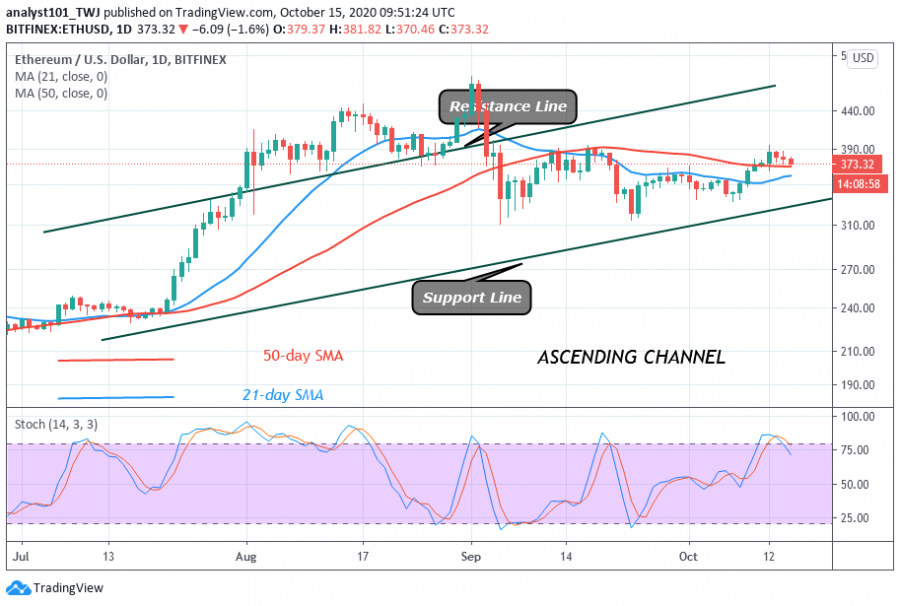
As a result of this deadlock, Ethereum is range bound between $365 and $395. On October 12, ETH rebounded at the $366 low as price broke the resistance levels to reach the $395 high. The upward move was immediately repelled as the coin dropped to $376 low.
Yesterday, buyers pushed the coin above $380 resistance but were repelled. Today, Ether has fallen and it is trading at $377 at the time of writing. On the upside, if buyers push the coin above $390 high and the bullish momentum is sustained, a rally to $488 is possible. On the other hand, if Ether falls and the bears break the $350 support, the coin will further decline to $310.
Ethereum Indicator Analysis
Ether is falling after the recent rejection at $388. On the daily chart, if the price breaks below the moving averages the downtrend will resume. The crypto is below the 80% range of the daily stochastic. This indicates that the coin has bearish momentum. The crypto is falling as a result of rejection at the recent highs.

Key Resistance Zones: $220, $240, $260
Key Support Zones: $160, $140, $120
What Is the Next Direction for Ethereum?
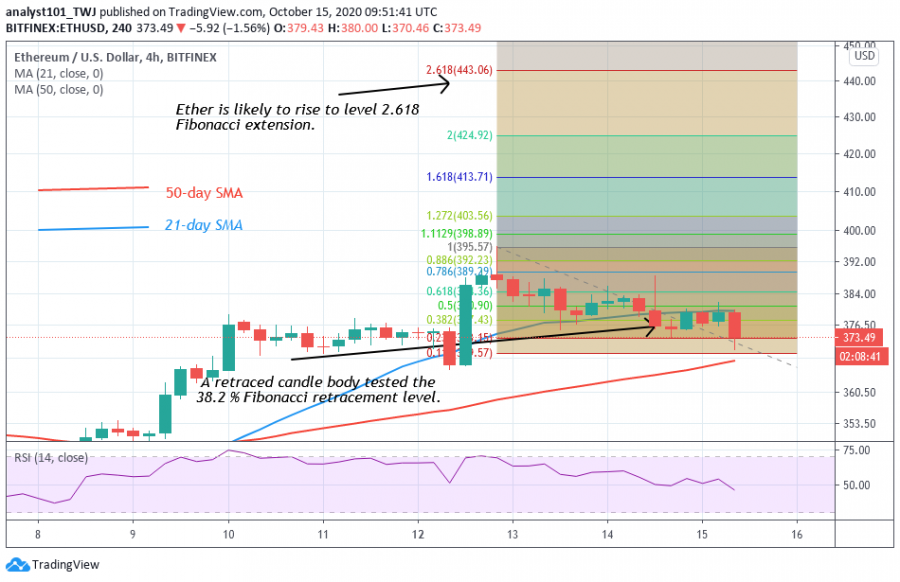
There is a high probability of Ethereum upward move once the resistance levels are broken. On the October 12 uptrend, Ether reached the high of $390 but was repelled. The last retraced candle body tested the 38.2 % Fibonacci retracement level. This gives a clue that the market will rise and reach the level at the 2.618 Fibonacci extension. This is equivalent to $443.06 high.

Disclaimer. This analysis and forecast are the personal opinions of the author and not a recommendation to buy or sell cryptocurrency and should not be viewed as an endorsement by CoinIdol. Readers should do their own research before investing funds.
Price
Price
Price
Price
Price

(0 comments)