Ethereum Holds Above $1,200 As Market Moves In Both Directions

The Ethereum price (ETH) is trading just above the support level of $1,200.
Long-term analysis of the Ethereum price: bearish
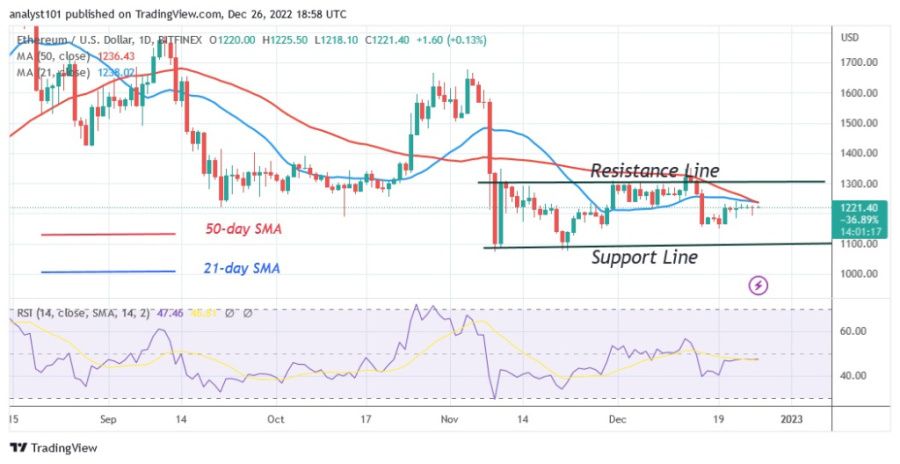
The price movement has been consistent with the presence of doji candlesticks since December 21. Today, the largest altcoin is consolidating above the support level of $1,200. The moving average lines have capped the uptrend. If the price breaks above the moving average lines and the resistance at $1,300, Ether will regain upward momentum. If buyers are successful, the largest altcoin will reach previous highs of $1,400 and $1,600. A break below the $1,200 support would send the altcoin to a low of $1,150 or $1,075.
Ethereum indicator analysis
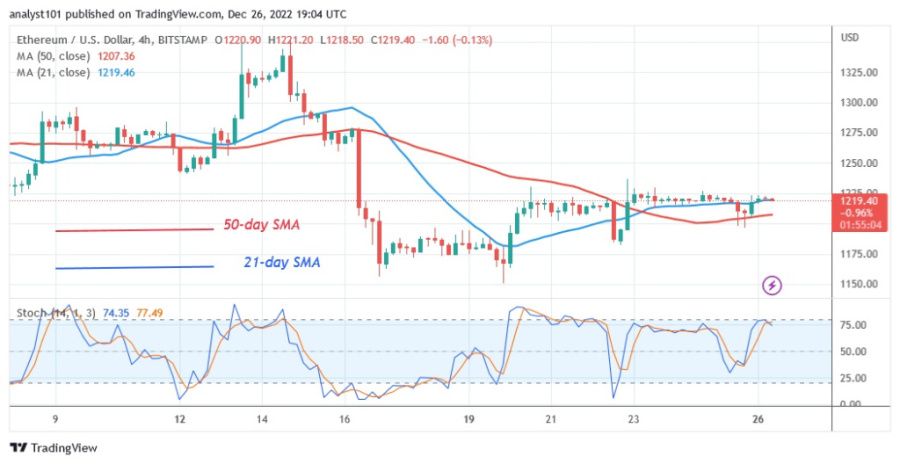
The Relative Strength Index for period 14 is at 47, thanks to the recent price recovery. Ether is in a bearish trend zone and faces another decline. A price decline is indicated by the price bars being below the moving average lines. The daily stochastic for Ether is at a level below 75. The market has moved in both directions.

Technical indicators
Key resistance levels - $2,000 and $2,500
Key support levels - $1,500 and $1,000
What is the next direction for Ethereum?
Ethereum is consolidating in a sideways movement above the support level of $1,200. Due to the presence of indecisive candles with small bodies known as doji, the altcoin is not showing any tendency. The current rally encounters resistance at the high of $1,225. If the price falls below the current support, the selling pressure could increase again.

Disclaimer. This analysis and forecast are the personal opinions of the author and are not a recommendation to buy or sell cryptocurrency and should not be viewed as an endorsement by CoinIdol. Readers should do their research before investing in funds.
Price
Price
Price
News
Price

(0 comments)