Ethereum Is In A Fluctuation Range As Traders Show Indifference
Updated: May 26, 2023 at 11:25

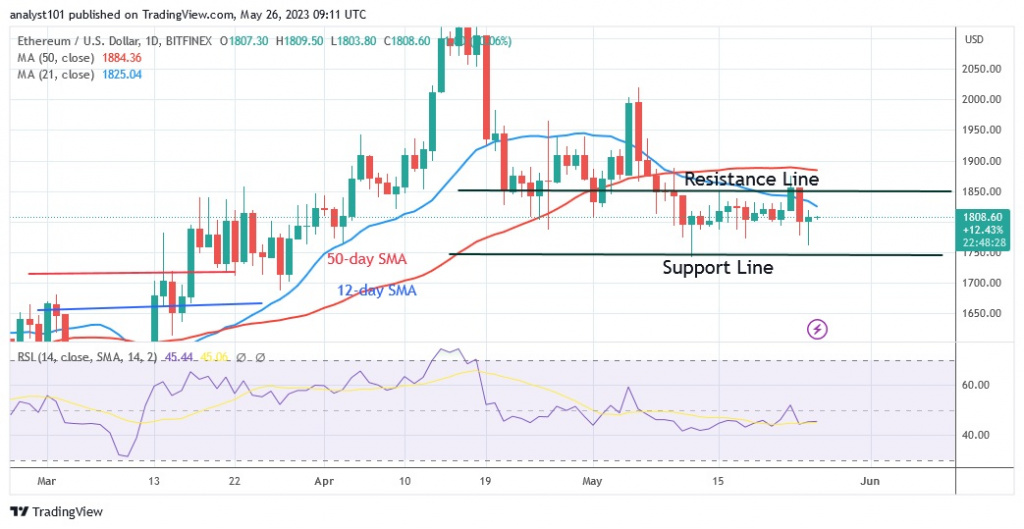
The Ethereum price (ETH) is falling below the moving average lines, but is above the support level of $1,770.
Long-term analysis of the Ethereum price: bearish
Ether is more likely to fall if it is trading below the moving average lines or in the downtrend zone. The largest altcoin is currently trading between $1,750 and $1,850. At the time of writing, one Ether is worth $1,813.70. The presence of the Doji candles has limited both the upward and downward movement. The price is moving slowly due to these candles. Candlesticks show that traders are not worried about the direction of the market. Currently, the resistance at $1,900 or the moving average lines prevent an upward movement. Ether will cross the psychological price barrier of $2,000. Despite the projected long tails of the candlesticks, buyers have consistently supported the current support level. Strong buying is taking place at lower price levels as shown by the extended candlesticks.
Ethereum indicator analysis
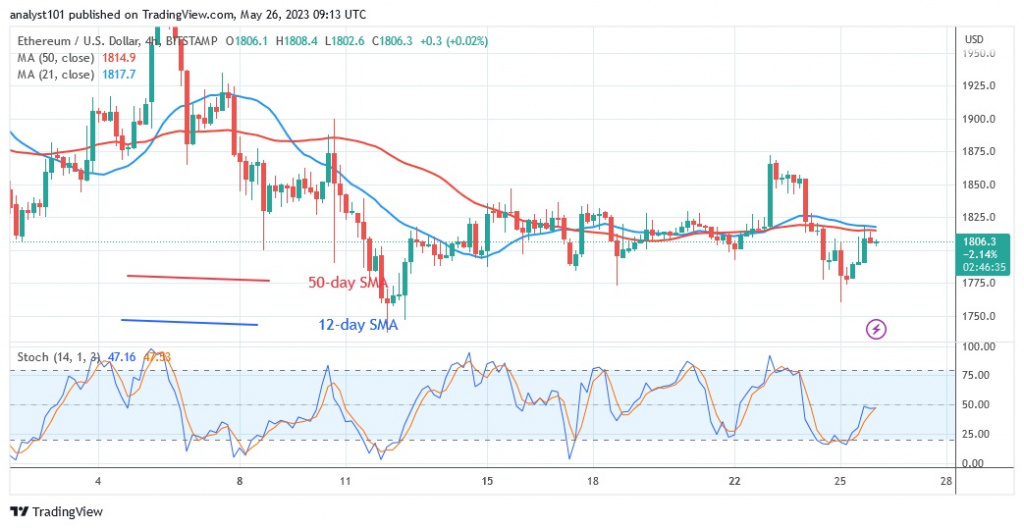
The Relative Strength Index for the cryptocurrency asset is at level 45. The Ether price is still in the downtrend zone and could fall further. Since the price bars are below the moving average lines, they are responsible for the current decline. Ether is below the daily stochastic level of 50 and is moving in a negative direction.

Technical indicators:
Key resistance levels - $2,000 and $2,500
Key support levels - $1,800 and $1,300
What does the next direction look like for Ethereum?
Ethereum is above the current support and the altcoin continues to move in a range bound movement. Doji candlesticks will continue to highlight Ether's fluctuating volatility. However, if the price breaks down or recovers, the altcoin will develop a trend.

Disclaimer. This analysis and forecast are the personal opinions of the author and are not a recommendation to buy or sell cryptocurrency and should not be viewed as an endorsement by CoinIdol. Readers should do their research before investing in funds.
Price
News
News
Coin expert

(0 comments)