Ethereum Declines on the Downside but Finds Support above $4,100

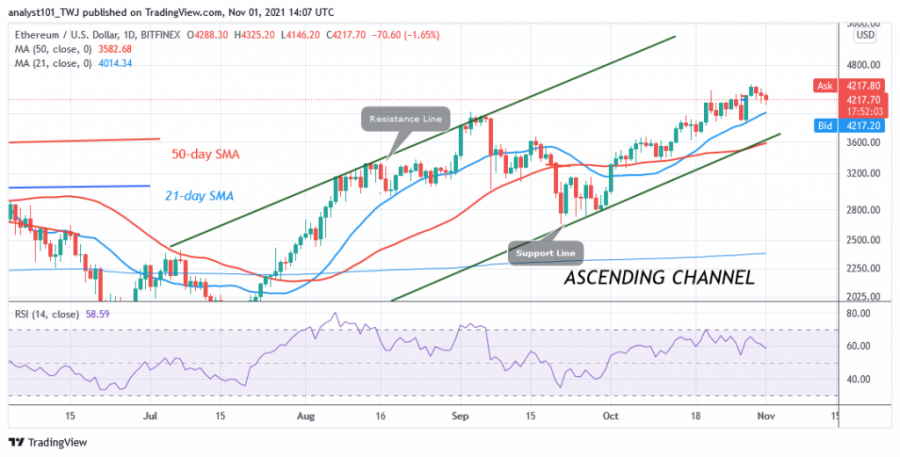
The price of Ethereum (ETH) has been falling steadily over the past four days, hitting a low of $4,175. Today, there are signs that the largest altcoin will continue to fall.
The bearish candlesticks are an indication of further downside. The Ether price has a series of lower highs and lower lows. Today, the price of ETH made a lower high at $4,320 and continues to fall to make a lower low. If selling pressure continues, the market will fall to $4,040. However, the bearish momentum may also extend to the previous low at $3,895. Meanwhile, Ethereum is falling back to support above the 21-day moving average line. The largest altcoin will resume its upward movement if the 21-day line SMA holds.
Ethereum indicator analysis
The cryptocurrency asset is at level 59 of the Relative Strength Index of period 14. Ethereum is in the uptrend zone and is capable of further upward movement. Ether is below the 40% area of the daily stochastic. This suggests that the largest altcoin is in a bearish momentum.

Technical indicators:
Major Resistance Levels - $4,000 and $4,500
Major Support Levels - $3,500 and $3,000
What is the next direction for Ethereum?
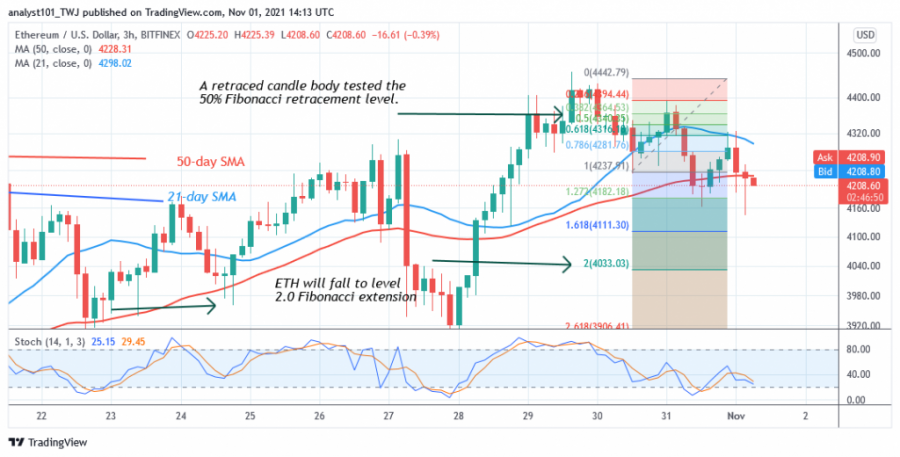
Ether is in a downtrend as the price falls below the moving average. Ether price is trying to hold above the 50-day line SMA. If it succeeds, the selling pressure will stop. Meanwhile, the downtrend from October 30 has shown a candle body testing the 50% Fibonacci retracement level. The retracement suggests that Ethereum will fall to the 2.0 Fibonacci extension level or $4,033.03.

Disclaimer. This analysis and forecast are the personal opinions of the author and are not a recommendation to buy or sell cryptocurrency and should not be viewed as an endorsement by CoinIdol. Readers should do their research before investing funds.
Price
PR
Business
Price
Price

(0 comments)