Ethereum Recovers above the Critical Support at $380, May Resume Uptrending

For over a week, Ethereum has been on a downward move. This current downtrend was caused by the bull’s inability to push ETH above the $420 resistance level.
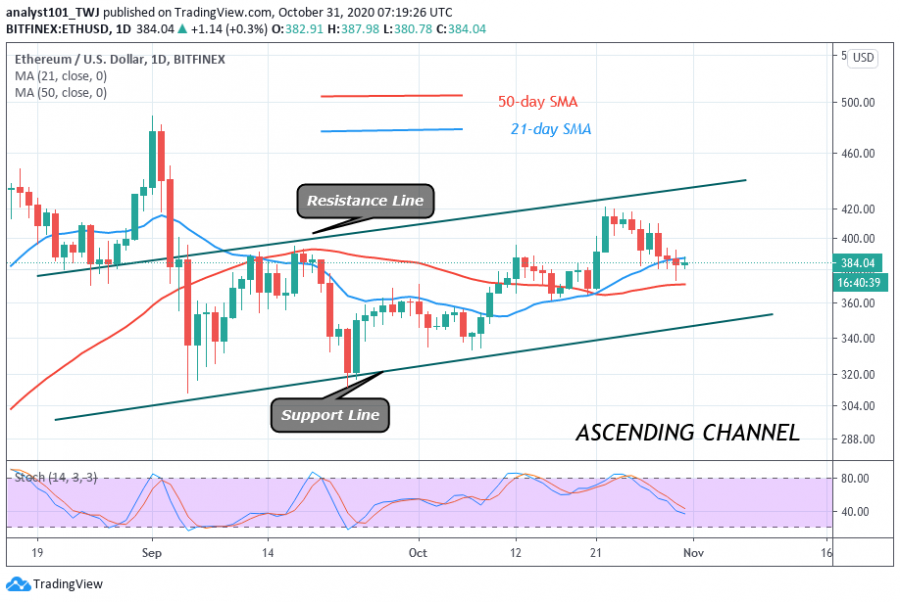
Yesterday, sellers pushed the biggest altcoin to the low at $374 but the price corrected upward above the $380 support. The bears and the bulls appear to battle with the price above the critical support at $380.
This critical support will determine the direction of price movement. The market will continue to trend on the downside if the bears break the support at $380. There is a possibility of a further decline to the low at $340. Conversely, if the bulls defend the critical support, Ether will rise and retest the $420 overhead resistance. Meanwhile, the coin is trading at $390 at the time of writing.
Ethereum indicator analysis
The bearish trend has broken below the 21-day SMA. Nevertheless, a break below the SMAs will trigger the downward movement of prices. The crypto is below the 40% range of the daily stochastic. It indicates that the coin is in a bearish momentum.

Key Resistance Zones: $220, $240, $260
Key Support Zones: $160, $140, $120
What is the next direction for Ethereum?
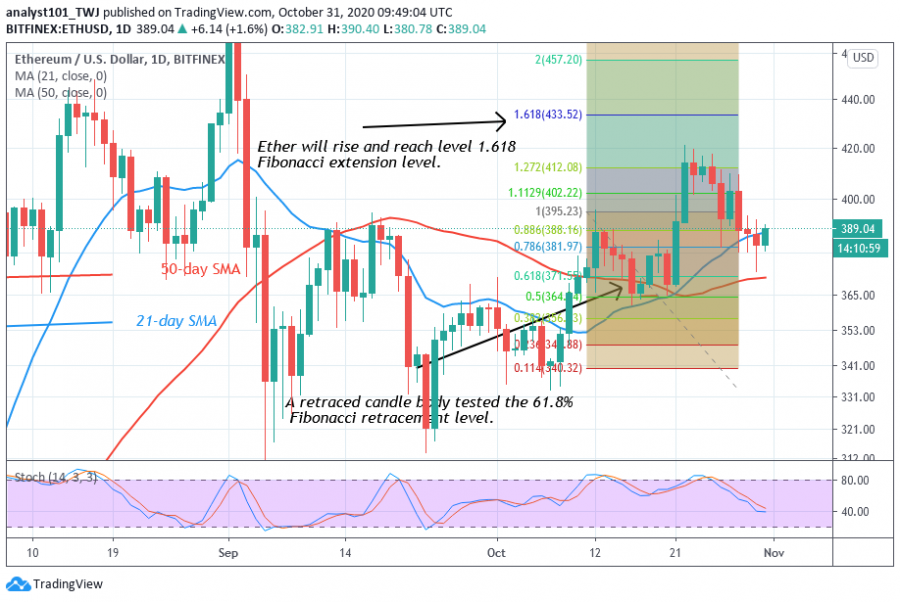
Ethereum downward move has extended to the critical support level. According to the Fibonacci tool analysis, Ether may further decline beyond $380 if the price level is breached. On October 12 uptrend; a retraced candle body tested the 61.8% Fibonacci retracement level. This indicates that the coin will rise to level 1.618 Fibonacci extensions or $433.52 high.

Disclaimer. This analysis and forecast are the personal opinions of the author that are not a recommendation to buy or sell cryptocurrency and should not be viewed as an endorsement by CoinIdol. Readers should do their own research before investing funds.
Price
Price
Price
News
Price

(0 comments)