Ethereum Collapses And Approaches The Low Of $3,231

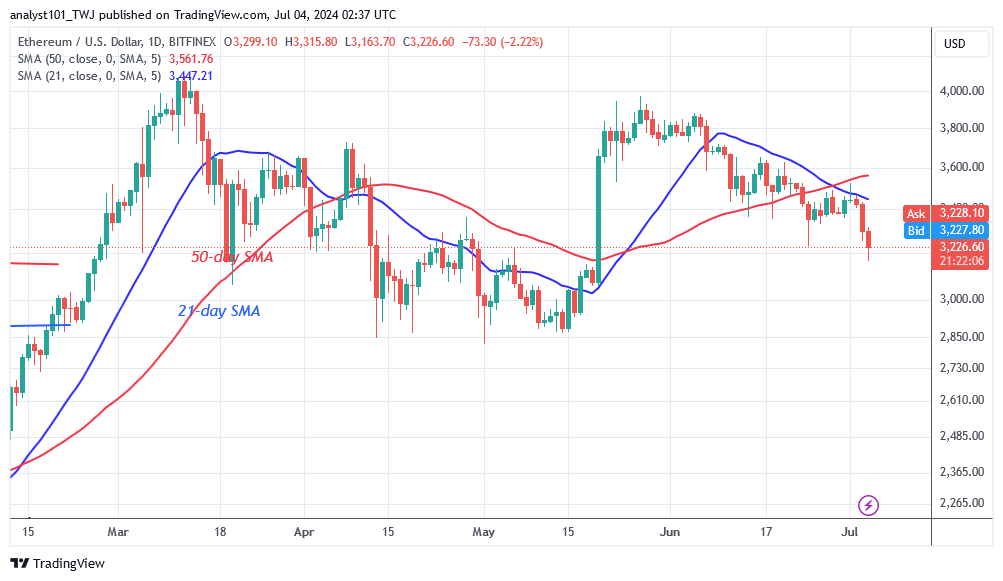
The latest price analysis by Coinidol.com report, the price of Ethereum (ETH) has been falling after hitting its previous low of $3231 on July 4.
Long-term analysis of the Ethereum price: bearish
The largest altcoin is confined to a range below the moving average lines as it attempts to resume a positive trend. After the dip on June 24, bulls bought the dips and Ether traded between $3,300 and below the 21-day SMA. On July 1, the bulls pushed the cryptocurrency above the moving average lines but were met with strong rejection. Today, Ether is in a nosedive and reached a low of $3,294. The selling pressure will continue once the current support level of $3,231 is breached. Ether is likely to reach the $3,000 mark.
Analysis of the Ethereum indicators
Ether has two bearish signals indicating that it is now falling. Ether had a long candlewick on July 1, which was resisted by the 21-day SMA. Currently, the 21-day SMA has crossed below the 50-day SMA, signaling a bearish crossing. Ether has fallen sharply and will continue to fall.

Technical indicators:
Key resistance levels – $4,000 and $4,500
Key support levels – $3,500 and $3,000
What is the next direction for Ethereum?
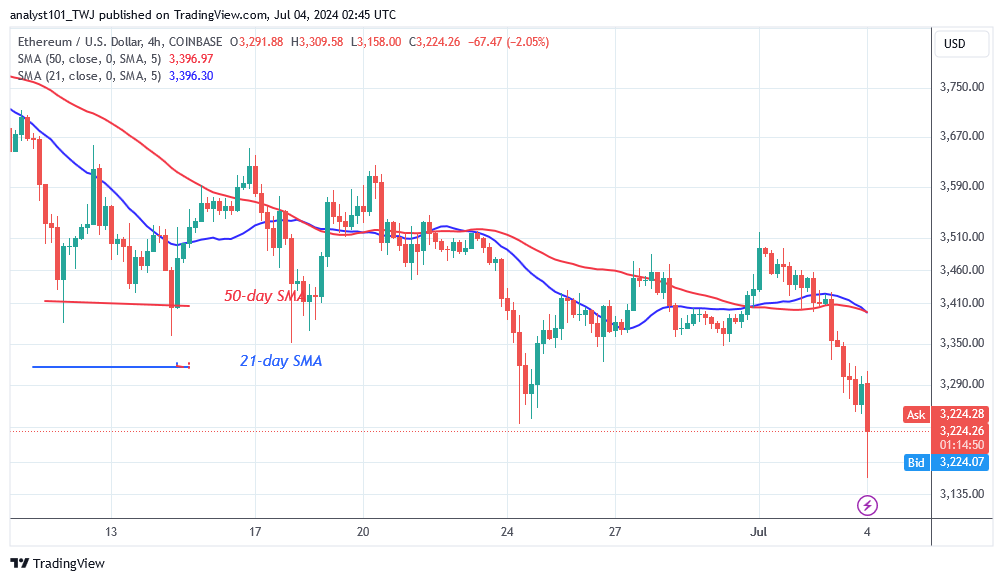
On the 4-hour chart, Ether is bearish and has reached a low of $3,251. On the downside, the altcoin is oscillating as the bears try to break the current support level of $3,231. Ethereum will fall to its low of $3,000 if it loses the current support. The choppy movement will continue above and below the moving average lines if the current support holds.

Disclaimer. This analysis and forecast are the personal opinions of the author. They are not a recommendation to buy or sell cryptocurrency and should not be viewed as an endorsement by CoinIdol.com. Readers should do their research before investing in funds.
News
Price
Price
Price
Price

(0 comments)