Ethereum Could Rally to $800 High if $620 Resistance Is Breached

Ethereum (ETH) price analysis, November 30, 2020.
Ethereum Price Long-Term Analysis: Bullish
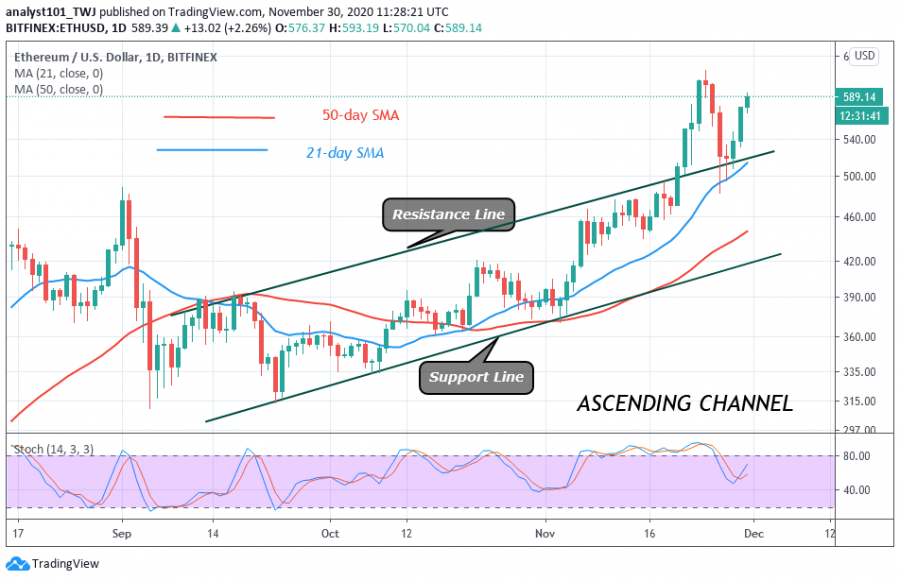
For the past five days, Ethereum has been in an upward move. On November 26, Ether had a breakdown as it dropped to a $489 low. It fell above the $450 support which has been the basis for upside momentum. Ethereum bulls have broken through the resistance levels and it is trading at $589 high. The biggest altcoin is likely to retest the $620 resistance.
If the bulls break the $620 resistance, Ether is likely to rise on the upside. Perhaps, the altcoin will rise and revisit the high of $838. This was the price level of April 30, 2018. Conversely, if the $620 resistance remains unbroken, the bears will push the crypto downward. A fall to the low at $480 is likely. Ethereum is rising and approaching the high of $595 at the time of writing.
Ethereum Indicator Analysis
Ethereum is rising because it is above the resistance line of the ascending channel. The coin is rising because it is above the 21-day and 50-day SMAs. A break below these levels will mean a downward movement of the coin. The coin is also above the 40% range of the daily stochastic. It indicates that it is in the bullish momentum.

Key Resistance Zones: $440, $460, $480
Key Support Zones: $160, $140, $120
What Is the Next Direction for Ethereum?
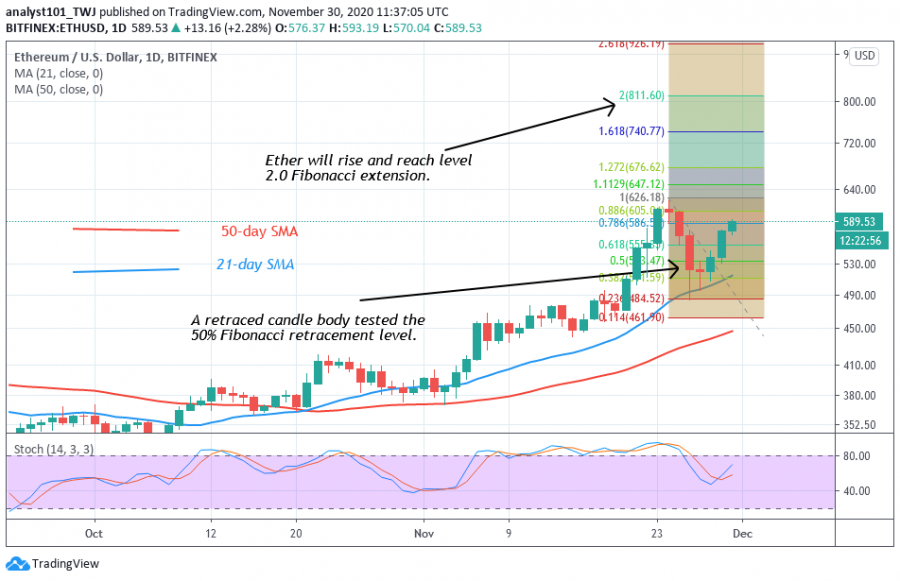
The price action has shown the upward movement of the coin. According to the Fibonacci tool, the coin will rise on the upside. On November 23 uptrend; a retraced candle body tested the 50% Fibonacci retracement level. This indicates that the coin will rise and reach level 2.0 Fibonacci extension level. That is the altcoin will reach a high of $811.60

Disclaimer. This analysis and forecast are the personal opinions of the author and not a recommendation to buy or sell cryptocurrency and should not be viewed as an endorsement by CoinIdol. Readers should do their research before investing funds.
Price
Price
Price
Price
Price

(0 comments)