Ethereum Faces Stiff Opposition at $2,000 Resistance zone, Unable to Push on the Upside

On February 18, 2021, Ethereum (ETH) bulls broke the $1,860 resistance as price rallied to the target price of $2000.
Ethereum Price Long-Term Analysis: Bullish
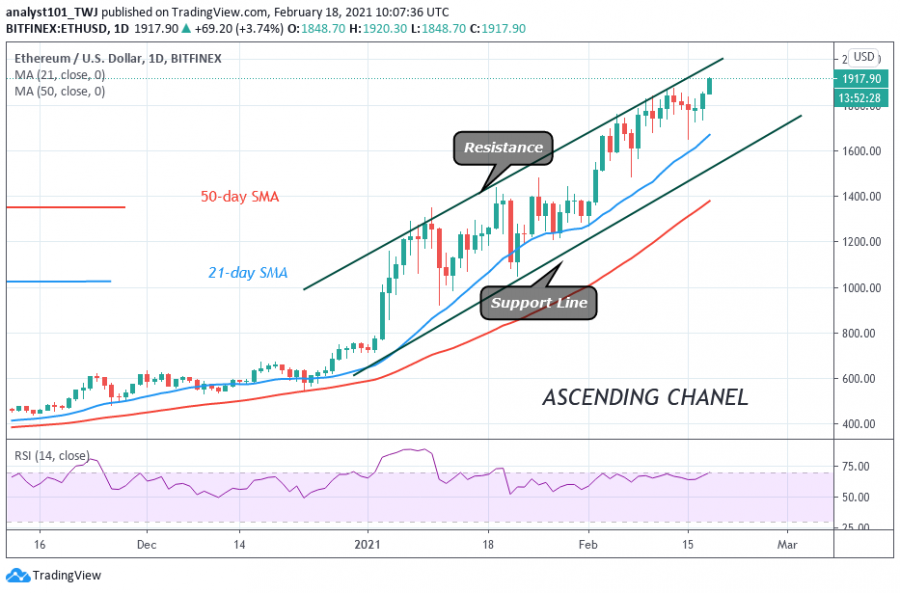
For the past week, Ether's price has been fluctuating between $1,700 and $1,860. Back in November Ethereum price fell to $1,649 low as bulls bought the dips. Now this in effect propels the price to break the resistance at $1,860 as the market rises to reach the target price at $2,000.
There are indications that the cryptocurrency will face stiff opposition at the $2,000 resistance zone. The market will fall to $1,750 low if the altcoin faces rejection at the resistance zone. On the other hand, if the bulls clear the resistance zone, the bullish momentum will extend to $2,500. Today, the price has risen to $1,923 at the time of writing.
Ethereum Indicator Analysis
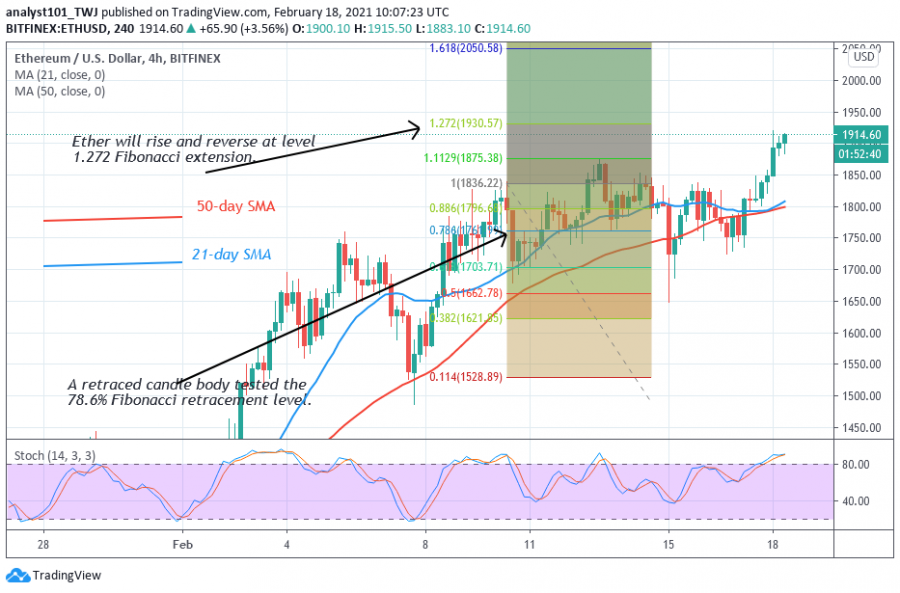
As price approaches the target price of $2.000, the daily stochastic has risen to level 90. The market has strong bullish momentum and price has reached the overbought region of the market. In a trending market, the overbought conditions may not hold. Ether is at level 67 of the Relative Strength index period 14. It also indicates that price is approaching the overbought region of the market.

Technical indicators:
Major Resistance Levels – $2,000 and $2,200
Major Support Levels – $1.400 and $1,200
What Is the Next Direction for Ethereum?
The Fibonacci tool has indicated an upward move of the biggest altcoin. The market is approaching the target price level of $1930.57. On February 10 uptrend; a retraced candle body tested the 78.6 % Fibonacci retracement level. This retracement indicates that ETH will rise to level 1.272 Fibonacci extensions or a high of $1,930.57. However, the price will reverse and return to 78.6% Fibonacci retracement where it originated. The market is still approaching this level.

Disclaimer. This analysis and forecast are the personal opinions of the author and not a recommendation to buy or sell cryptocurrency and should not be viewed as an endorsement by CoinIdol. Readers should do their research before investing funds.
Price
Price
Price
Price
Price

(0 comments)