Polkadot Reaches Oversold Region and Takes Aim at $15 Low

The price of Polkadot (DOT) has come under renewed selling pressure after the altcoin fell below the previous low of $17.
Polkadot (DOT) price long-term analysis: bearish
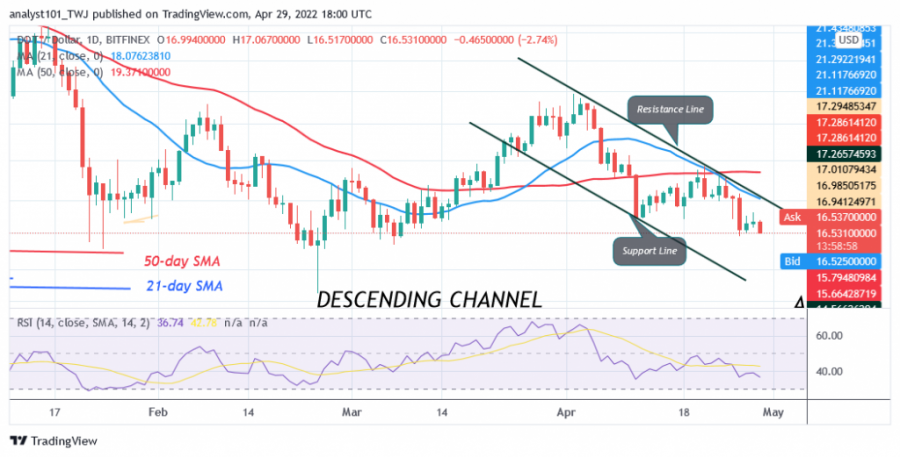
Polkadot has fallen to the low of $16 and the current bearish momentum will extend to the lows of either $14 or $15. If the cryptocurrency price holds above the $15 level, DOT/USD will be forced into a trading range between $15 and $19. On the upside, the altcoin will rise above the moving averages if the bulls overcome the resistance at $19. After that, the bullish momentum will extend to the $22 high.
Polkadot (DOT) indicator analysis
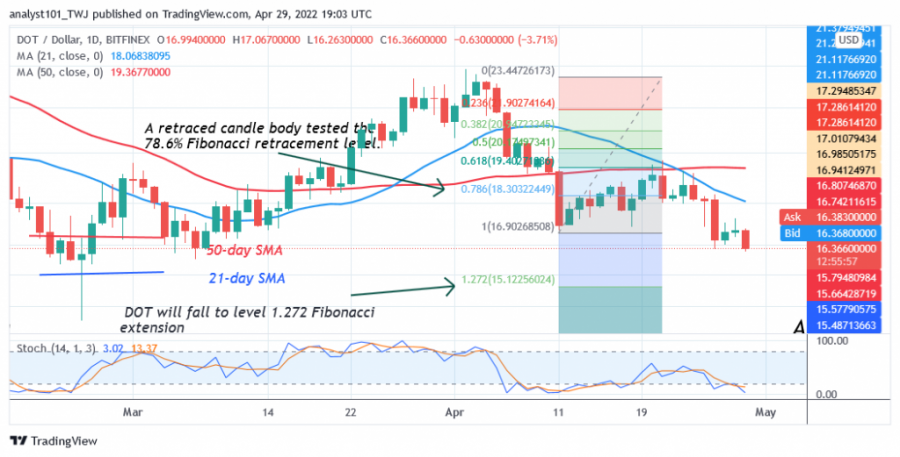
The cryptocurrency is at the level 35 of the Relative Strength Index for the period 14. The altcoin is in the downtrend zone and below the midline 50. DOT The price is below the moving averages, which are responsible for the current price decline. The altcoin is below the 20% range of the daily stochastic. This indicates that the market has reached the oversold zone. The 50-day line SMA and the 21-day line SMA are sloping downwards, indicating a downtrend.

Technical Indicators:
Key resistance levels - $52 and $56
Key support levels - $28 and $24
What is the next direction for Polkadot (DOT)?
DOT/USD is in a downtrend as the altcoin reaches the oversold region of the market. Meanwhile, on April 11, the downtrend; a retraced candlestick tested the 78.6% Fibonacci retracement level. The retracement suggests that the price of DOT will fall to the Fibonacci extension level of 1.272 or the level of $15.12.

Disclaimer. This analysis and forecast are the personal opinions of the author and are not a recommendation to buy or sell cryptocurrency and should not be viewed as an endorsement by CoinIdol. Readers should do their research before investing funds.
PR
Business
Price
Price
Price

(0 comments)