Dogecoin Consolidates Above $0.08 as Buyers and Sellers Reach Indecision

Dogecoin (DOGE) price is down, but small unresolved candlesticks have dominated the price movement. These candlesticks indicate that both buyers and sellers are uncertain about the direction of the market.
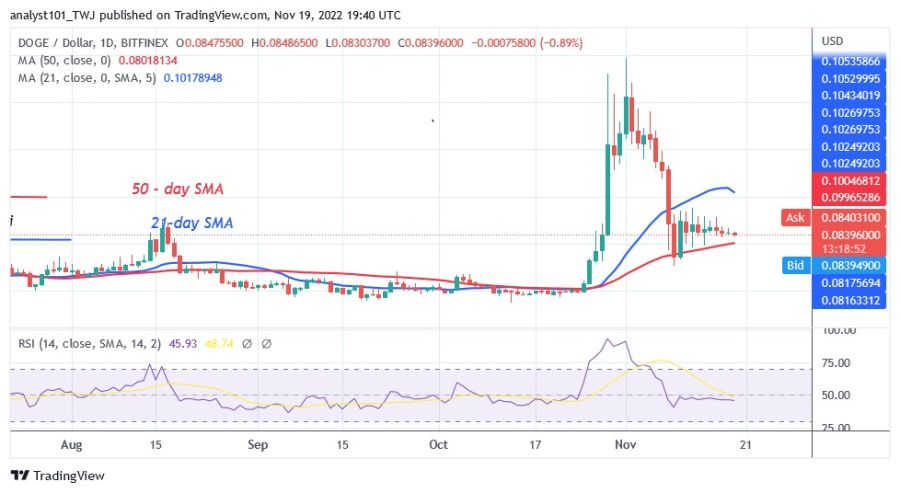
In the meantime, the cryptocurrency is oscillating between the moving average lines. DOGE is rising at the moment as it approaches the 21-day line SMA. A price recovery will push DOGE up above the 21-day line SMA. The earlier highs will be reached by the bullish momentum. Likewise, if DOGE falls below and breaks below the 50-day line SMA, the market will retrace to its previous low at $0.05. At press time, DOGE/USD was trading at $0.084.
Dogecoin indicator reading
As DOGE reaches 45 on the Relative Strength Index for the period 14, it has experienced a significant decline. The decline could be due to the fact that it is in the downward zone. The price bars of the cryptocurrency are between the moving average lines, which indicates that DOGE might be in a range. The daily value of the Stochastic is above the 25 level, but the bullish momentum is shaky.

Technical indicators:
Major Resistance Levels - $0.12 and $0.14
Major Support Levels - $0.06 and $0.04
What is the next direction for Dogecoin?
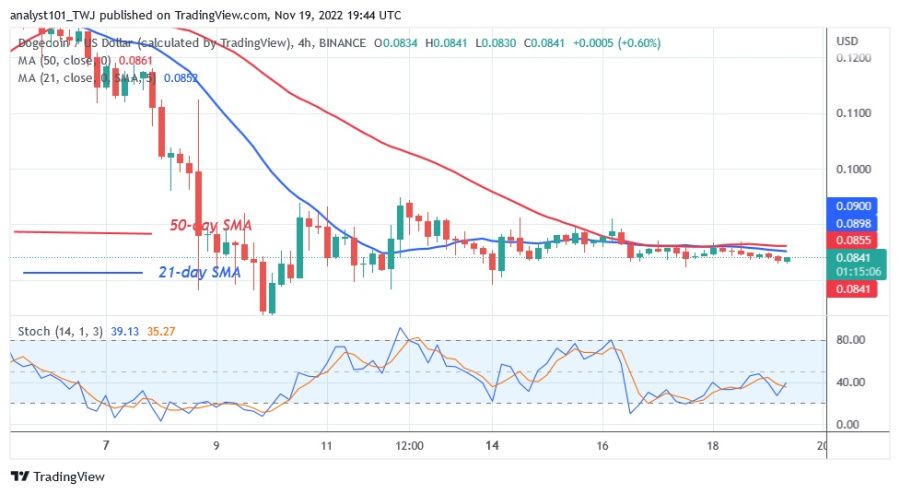
According to the 4-hour chart, Dogecoin is moving sideways. Above the $0.08 support, the altcoin is consolidating. Doji candlesticks, which have small bodies and are indecisive, are another feature of the price action.

Disclaimer. This analysis and forecast are the personal opinions of the author and are not a recommendation to buy or sell cryptocurrency and should not be viewed as an endorsement by Coin Idol. Readers should do their own research before investing in funds.
Price
Price
Price
Price
Price

(0 comments)