Dogecoin Share Price Fluctuates As It Slumps To $0.154 Low
Updated: Jun 04, 2024 at 13:07

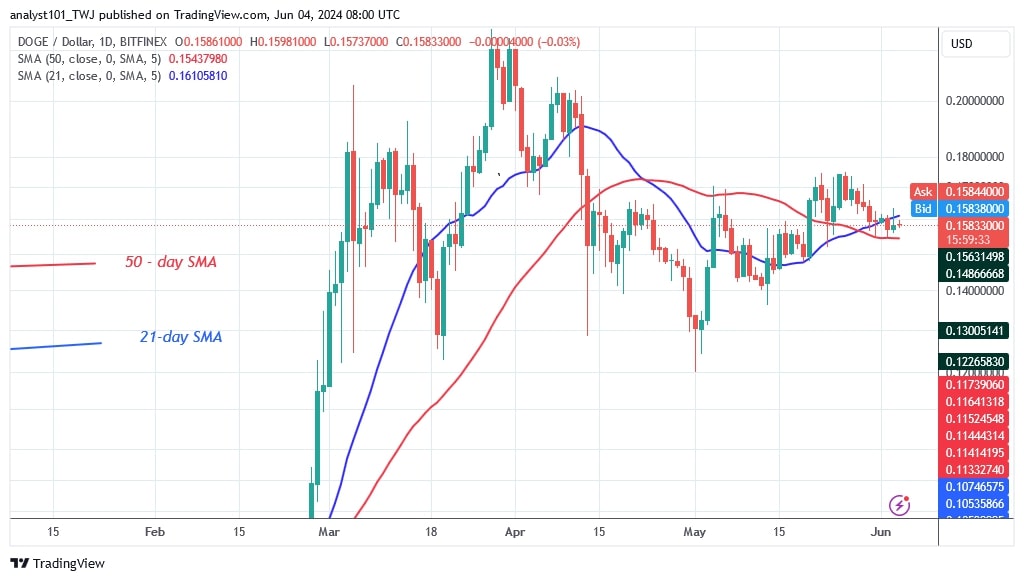
The price of Dogecoin (DOGE) is above the 50-day SMA support but below the 21-day SMA. Since May 21, bulls and bears have been at odds over the market direction.
Dogecoin price long-term forecast: bearish
On June 2, the bears gained the upper hand by breaking below the 21-day SMA. This suggests that the bearish momentum will continue above or beyond the 50-day SMA.
If the price of the cryptocurrency falls below the moving average lines, the bearish momentum will continue to the low of $0.14. In the meantime, DOGE is trapped between the moving average lines. The break of any of the moving average lines will indicate the trend of the asset. At the time of writing, DOGE was trading at $0.15.
Dogecoin indicator reading
DOGE's uptrend has come to an end after buyers failed to sustain the positive momentum above the $0.17 resistance level. The altcoin has come under renewed selling pressure after falling below the 21-day moving average line. The price of DOGE is fluctuating as long as the price bars remain within the moving average lines.
Technical Indicators
Key resistance levels - $0.22 and $0.24
Key support levels – $0.14 and $0.12

What is the next direction for Dogecoin?
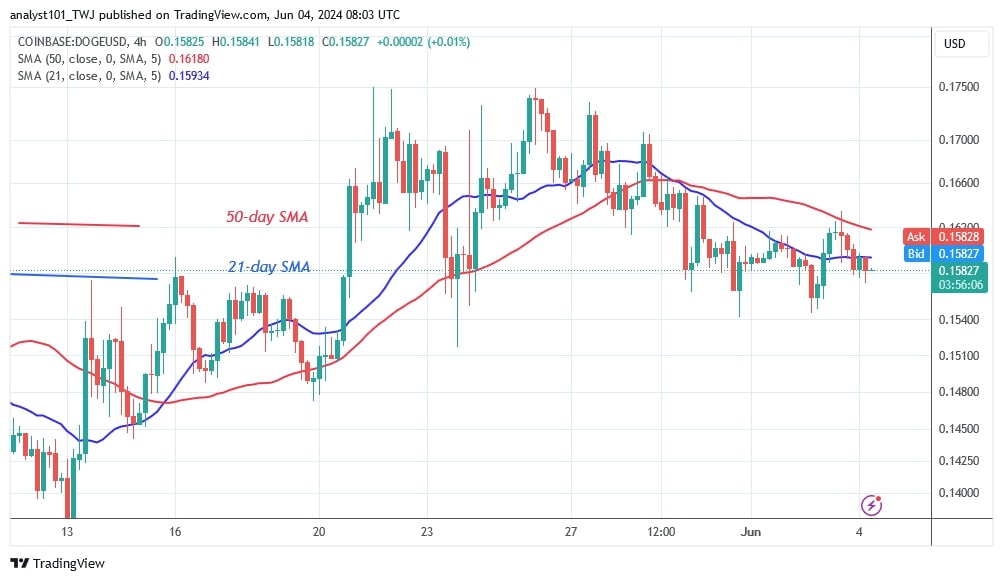
DOGE is falling below the moving average lines on the 4-hour chart. The price of the cryptocurrency is showing a trend of declining highs and lows. The altcoin is already reaching the current support level of $0.15. There are long candlestick tails pointing to the current support level of $0.15. This shows that there is considerable buying demand near $0.15.

Disclaimer. This analysis and forecast are the personal opinions of the author and are not a recommendation to buy or sell cryptocurrency and should not be viewed as an endorsement by CoinIdol.com. Readers should do their research before investing in funds.
News
Price
Price
News
Price

(0 comments)