Dogecoin Is in a Deadlock as It Struggles Below $0.078 High
Updated: Jul 10, 2022 at 09:58

The price of Dogecoin (DOGE) is in a downward correction, but is contained between moving average lines.
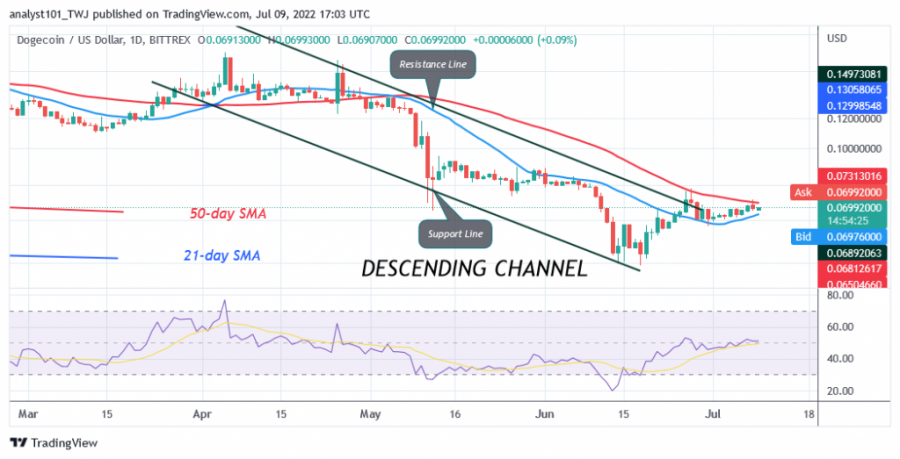
Last week, the cryptocurrency was in an upward correction. The bulls broke through the 21-day line SMA, but got stuck at the 50-day line SMA. In other words, it was rejected at the $0.078 resistance.
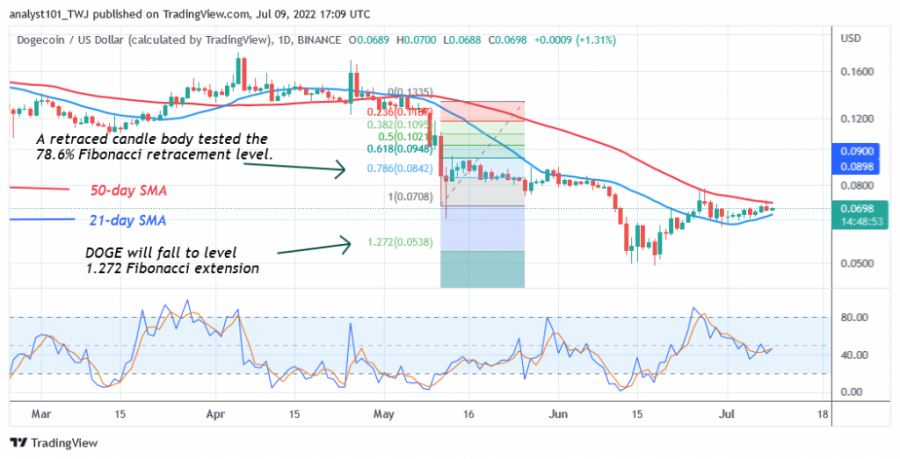
Dogecoin traded above the 21-day line SMA, but below the 50-day line SMA. The cryptocurrency is capable of reaching the high of $0.10 if the bulls break out above the 50-day line SMA. If the bears fall below the 21-day line SMA, DOGE will fall and regain the previous low of $0.05. In the meantime, DOGE/USD is squeezed between the moving average lines.
Dogecoin indicator reading
DOGE is at the level 50 of the Relative Strength Index for the period 14. It indicates that there is a balance between supply and demand. The price bars of the cryptocurrency are above the 21-day line SMA, but below the 50-day line SMA, indicating a movement within a range. The 21-day line SMA and the 50-day line SMA are sloping south, indicating a downtrend.

Technical indicators:
Major Resistance Levels - $0.12 and $0.14
Major Support Levels - $0.06 and $0.04
What is the next direction for Dogecoin?
Dogecoin is still in a downtrend despite the upward correction. The short uptrend was marked by small indecisive candlesticks called doji. These candlesticks indicate that buyers and sellers are undecided about the direction of the market. Dogecoin will develop a trend when the moving average lines are broken.

Disclaimer. This analysis and forecast are the personal opinions of the author and are not a recommendation to buy or sell cryptocurrency and should not be viewed as an endorsement by Coin Idol. Readers should do their own research before investing funds.
News
News
Coin expert

(0 comments)