Dogecoin Stagnates Above $0.069 Support As Strong Buying Occurs

Dogecoin (DOGE) price is falling below the moving average lines.
Dogecoin price long-term forecast: bearish
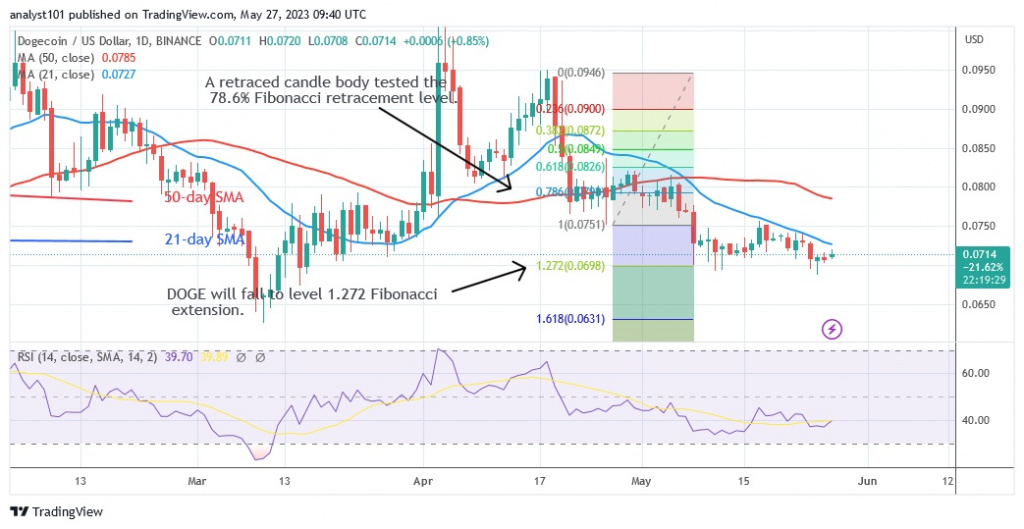
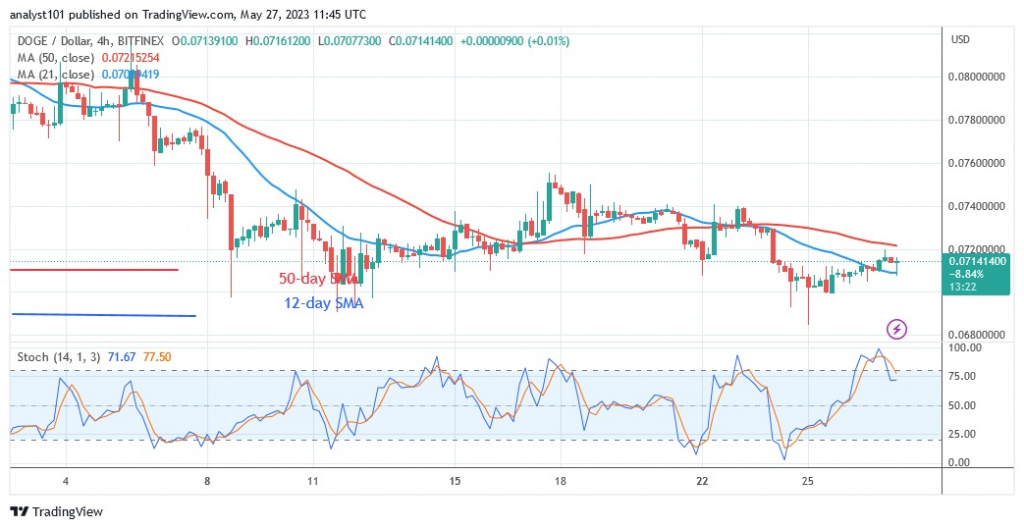
Since May 11, the price has been stationary above the $0.069 support. Since May 11, the price of DOGE /USD has been restricted to a range between $0.069 and $0.0750. The 21-day line SMA and the resistance at $0.0750 have slowed down the upward movements. The presence of Doji candlesticks stalled the price movement. The Doji candlesticks show that both buyers and sellers are uncertain in which direction the market will move. The price indication at 1.272 of the Fibonacci extension or $0.069 suggests a likely decline and reversal to the negative. Price activity shows that there is strong buying at lower price levels.
Dogecoin indicator display
The Relative Strength Index (RSI) is at 40 for period 14. The RSI has not changed due to consolidation and the presence of Doji candlesticks. The price bars below the moving average lines increase the probability of a future decline. However, the decline has taken on a bearish pace.

Technical Indicators
Key resistance levels - $0.12 and $0.14
Key support levels - $0.06 and $0.04
What is the next direction for Dogecoin?
The price signal suggests that DOGE /USD has reached bearish exhaustion. As a result, the cryptocurrency price is settling above the $0.069 support. However, if the consolidation continues, the price may rally.

Disclaimer. This analysis and forecast are the personal opinions of the author and are not a recommendation to buy or sell cryptocurrency and should not be viewed as an endorsement by Coin Idol. Readers should do their own research before investing in funds.
Price
News
Price
Price
Price

(0 comments)