Cardano Falls Back On The Test Of The $0.64 Mark

The price of Cardano (ADA) is trading above its moving average lines. Cardano price analysis by Coinidol.com.
Long-term forecast for the Cardano price: bullish
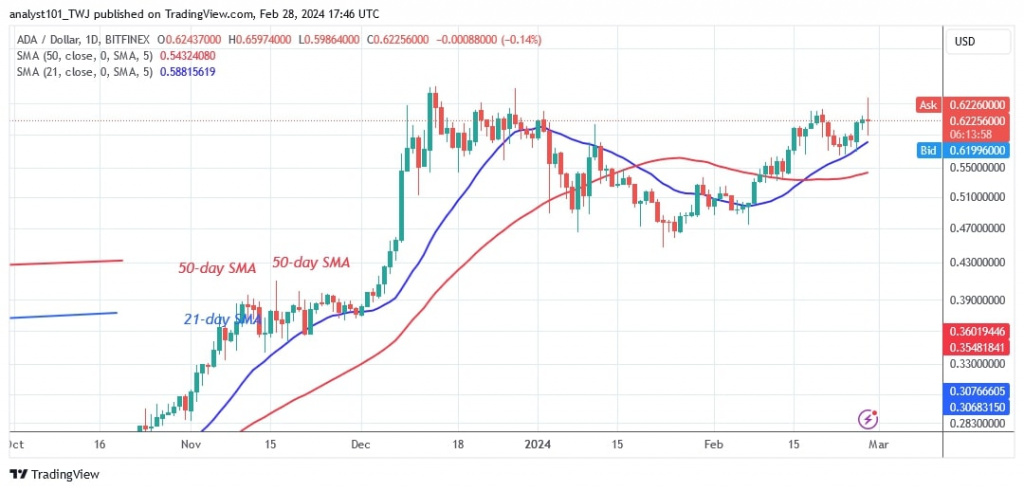
Since February 20, the altcoin has failed to surpass its last price of $0.64. Buyers tried to push the altcoin above its recent high but were rebuffed at $0.65. Following the latest rejection, the cryptocurrency has retraced above the 21-day SMA. If the 21-day SMA support holds, Cardano will continue to trade sideways above the moving average lines.
The current sideways movement indicates an uptrend. However, if the altcoin falls below the moving average lines, selling pressure will increase again. The altcoin will fall further to its previous low of $0.45.
Technical indicators
Important resistance zones: $0.50, $0.55, $0.60
Important support zones: $0.30, $0.25, $0.20
Cardano indicator analysis
Altcoin prices have pulled back above the moving average lines. The price of ADA will continue to rise as long as it stays above the moving average lines. On February 28, the candle has a long wick and a long tail. The extended wick of the candle signals strong selling pressure at the higher price point.

What is the next move for Cardano?
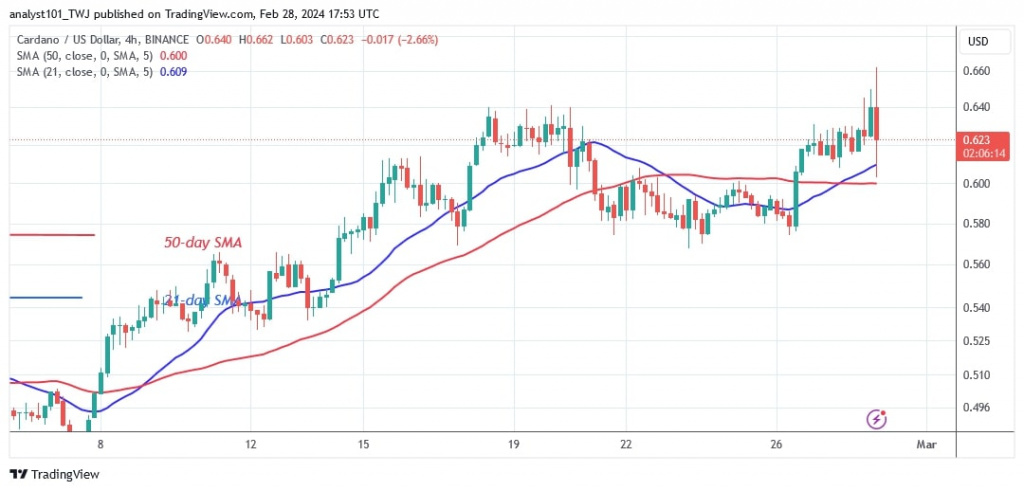
The 4-hour chart of Cardano shows a sideways movement after the price drop on February 20. Today, the altcoin is back at a high of $0.65 after its rejection. The cryptocurrency is holding above the 21-day SMA. Selling pressure will return if the price falls below the moving average lines.

Disclaimer. This analysis and forecast are the personal opinions of the author and are not a recommendation to buy or sell cryptocurrency and should not be viewed as an endorsement by CoinIdol.com. Readers should do their research before investing in funds.
News
Price
PR
Business
Price

(0 comments)