Cardano Hovers above $2.0 Support, May Slide Into Deeper Correction

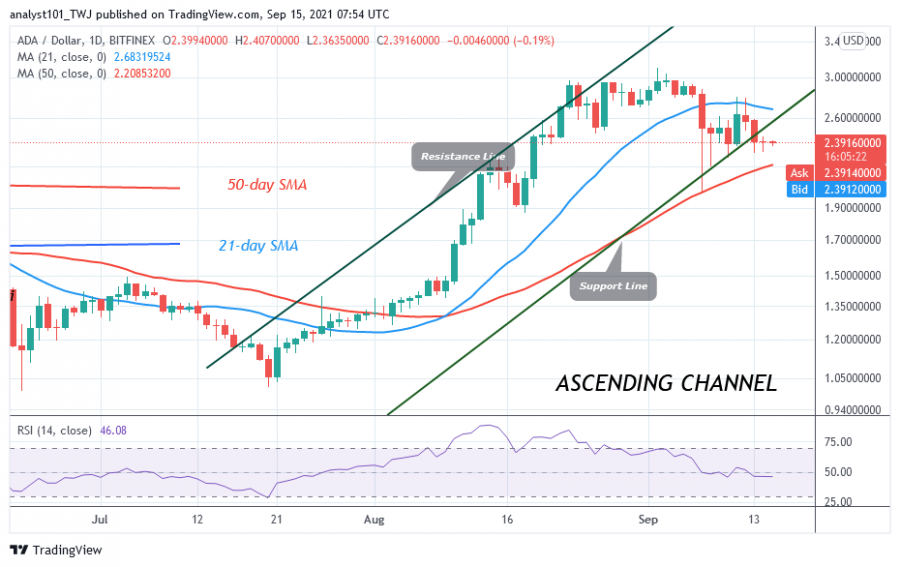
The price of Cardano (ADA) is consolidating above support at $2.0 Today Cardano is trading marginally at $2.39.
This price level is between the 21-day SMA and the 50-day SMA. The upward or downward movement of the cryptocurrency is dependent on the crossing of these moving averages.
If sellers break the 50-day SMA line, the altcoin will continue to fall to a low of $1.40. This could lead to a deeper correction. On the other hand, if buyers push the altcoin above the 21-day line SMA, this would signal the resumption of an uptrend. The market will also rise to retest the previous high of $3.10. In the meantime, price action is stagnant above the $2.0 support.
Cardano indicator analysis
Cardano is at level 46 of the Relative Strength Index of period 14, indicating that the market is in the downtrend zone and below the midline 50. The cryptocurrency can fall to the downside. The 21-day line SMA and the 50-day line SMA are up and indicate an uptrend. ADA is above the 40% area of the daily stochastic. This suggests that the market is in a bullish momentum.

Technical indicators:
Major Resistance Levels - $3.50 and $4.00
Major Support Levels - $3.00 and $2.50
What is the next move for Cardano?
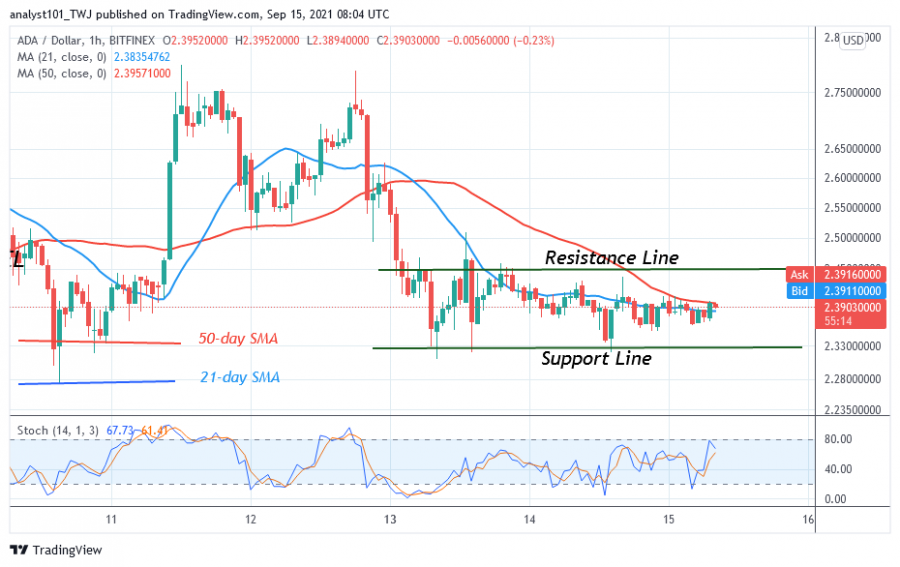
Cardano (ADA) is in a choppy price action. The choppy price action is characterized by small candlestick bodies. The altcoin is consolidating above the $2.33 support, moving in a tight range. A break above resistance will force the altcoin to resume the uptrend. A breakout will push the altcoin to the downtrend.

Disclaimer. This analysis and forecast are the personal opinions of the author and are not a recommendation to buy or sell cryptocurrency and should not be viewed as an endorsement by CoinIdol. Readers should do their own research before investing funds.
Price
Price
Price
Price
Price

(0 comments)