Bitcoin Continues To Hold Above $42,000 As Bulls And Bears Reach Compromise

The price of Bitcoin (BTC) is in a downward correction as the largest cryptocurrency fell to a low of $42,137 on April 8.
Bitcoin (BTC) Price Long-Term Forecast: Bearish
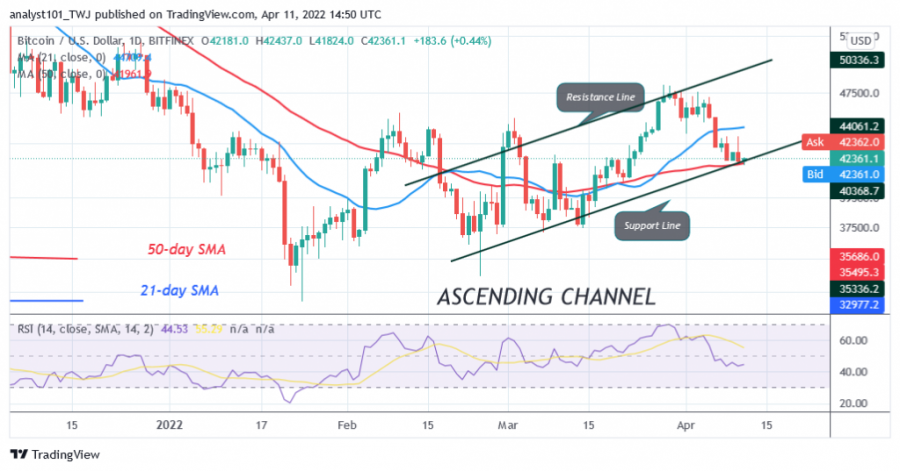
Today, the BTC price is still trading at $42,262. In other words, Bitcoin is trading above the 50-day moving average line. In the last four days, the cryptocurrency has been trading above the 50-day line SMA, but below the 21-day line SMA. Bitcoin trends when the moving averages lines are broken.
For example, if the bears break below the 50-day line SMA, the market will fall to a low of $37,577. Buyers will try to defend the support at $37,000 as this was a strong support. In the same vein, Bitcoin will develop bullish momentum again if the bulls break out above the 21-day line SMA. A break above the recent high will push the BTC price to retest the overriding resistance at $48,000. In the meantime, Bitcoin will continue its move between the moving averages if the range lines remain unbroken.
Bitcoin (BTC) Indicator Reading
Bitcoin has fallen to level 44 on the Relative Strength Index for the 14 period. The RSI has continued to fall as Bitcoin has retreated from the previous high. Bitcoin has resumed its sideways movement as the cryptocurrency price is between the moving averages. The BTC price has fallen below the 20% range of the daily stochastic. However, the cryptocurrency price is fluctuating below and above the oversold region of the market. The bearish momentum is not certain. The 21-day line SMA and the 50-day line SMA are sloping south, indicating a downtrend.

Technical Indicators:
Key resistance levels - $65,000 and $70,000.
Key support levels - $60,000 and $55,000
What is the next direction for BTC/USD?
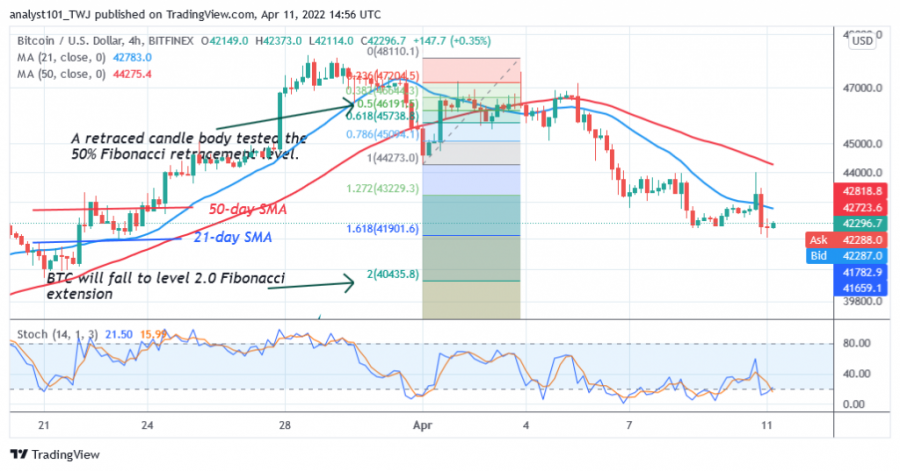
Bitcoin is in a downtrend, but the price indicator has indicated further downward movement of the cryptocurrency. Meanwhile, on April 1, the downtrend; a retracement candlestick tested the 50% Fibonacci retracement level. The retracement suggests that Bitcoin will fall to the 2.0 level of the Fibonacci extension or $40,621.90. Since April 8, the price of BTC has been holding above the $42,000 support.

Disclaimer. This analysis and forecast are the personal opinions of the author and are not a recommendation to buy or sell cryptocurrency and should not be viewed as an endorsement by CoinIdol. Readers should do their own research before investing funds.
News
Price
Price
News
News

(0 comments)