BNB Faces Further Rejections At $220 As It Enters A New Range

Cryptocurrency price analysis brought by Coinidol.com. The BNB price has fallen below the previous low of the cryptocurrency.
BNB price long term forecast: bearish
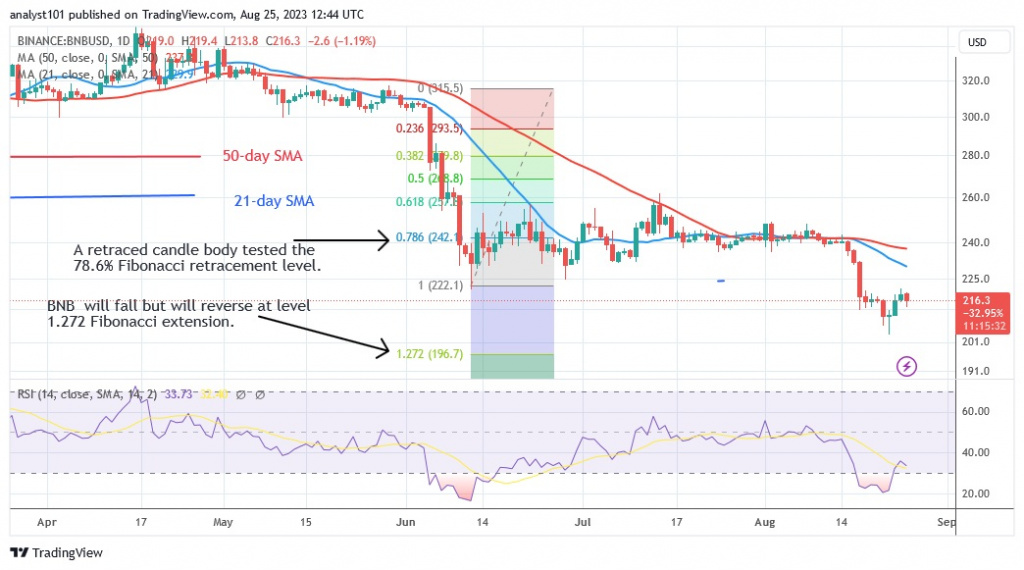
During the recent decline, the altcoin was expected to reach a low of $196.70. According to the price action, BNB has fallen to a low of $203 as the bulls bought the dips. If the current support is broken, the market will fall to the 1.272 Fibonacci extension or $196.70.
The bears broke the previous low of $220 and hit a new low of $203. Today, the cryptocurrency price is correcting upwards, although it is facing resistance above the high of $220. If BNB is rejected at the current high, it will be forced to trade in a range. At the time of writing, the altcoin is worth $216.
BNB indicator display
The altcoin is correcting upward while exceeding the Relative Strength Index Level 36 for the period 14. Despite the recent upswing, the cryptocurrency remains in a gloomy trend. As the daily stochastic exceeds the level of 50, the cryptocurrency is rising. The altcoin is moving within a certain range, with the upward momentum experiencing resistance near the recent high.

Technical Indicators:
Key resistance levels – $300, $350, $400
Key support levels – $200, $150, $100
What is the next direction for BNB/USD?
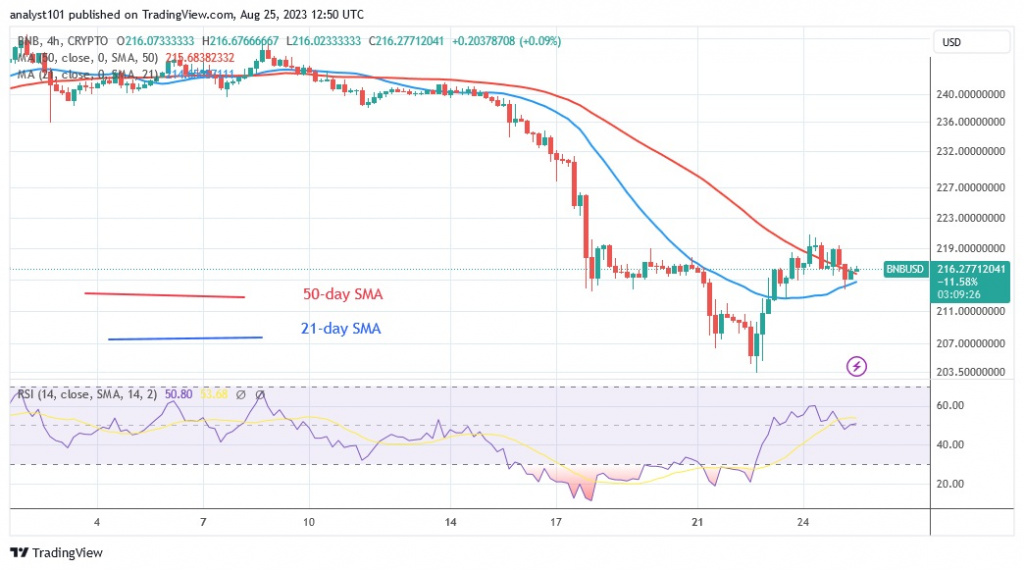
After its recent decline, BNB is now trading sideways below the $220 resistance level. The recent high is limiting the upside movement. The market will most likely oscillate between $200 and $220. On the downside, buyers will be attracted if the current $200 support level is breached.

On August 19, 2023 cryptocurrency analytics specialists of Coinidol.com stated that according to the price indicator, the cryptocurrency asset has fallen below the current support level of $220 and may fall further.
BNB completed a downward correction to the upside on June 12 and a candlestick tested the 78.6% Fibonacci retracement line.
Disclaimer. This analysis and forecast are the personal opinions of the author and are not a recommendation to buy or sell cryptocurrency and should not be viewed as an endorsement by CoinIdol.com. Readers should do their research before investing in funds.
Price
News
Price
Price
News

(0 comments)