Bitcoin Is Stagnating Due To Traders' Disinterest

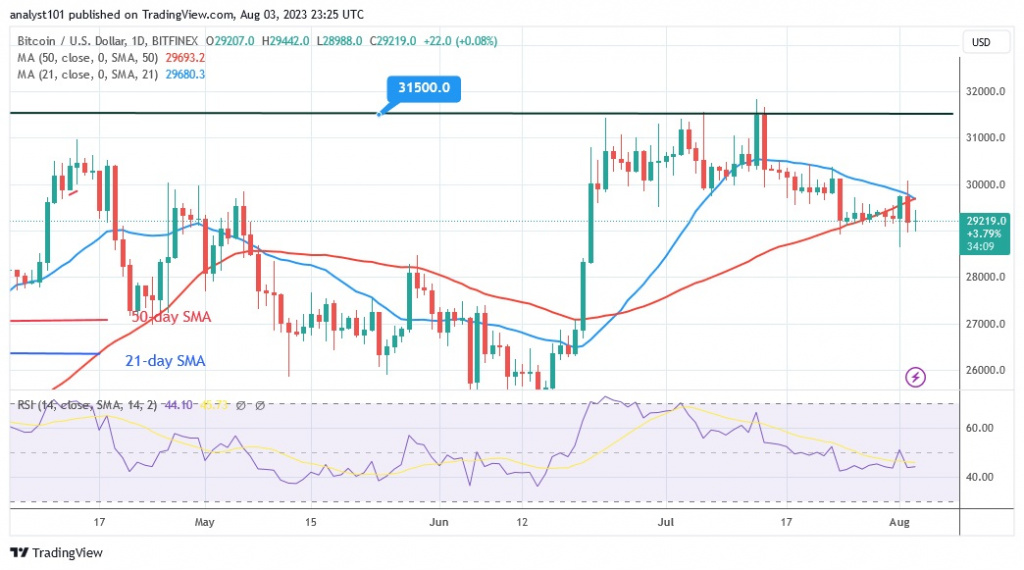
Bitcoin (BTC) price is still stable above $29,000, although it is falling below the 50-day line SMA.
Bitcoin price long term forecast: bearish
Bulls bought dips when the Bitcoin price fell to a low of $28,637 on August 1. The crypto price retested the psychological price level of $30,000 after its recovery. After that, Bitcoin fell significantly above the existing support.
The $30,000 upside barrier inhibits the upward movement. Similarly, the support at $29,000 prevented the downtrend from deteriorating. Once these hurdles are overcome, Bitcoin will start a new trend. In the meantime, the price movement was controlled by the Doji candlestick pattern, a small group of confusing candles.
Bitcoin indicator display
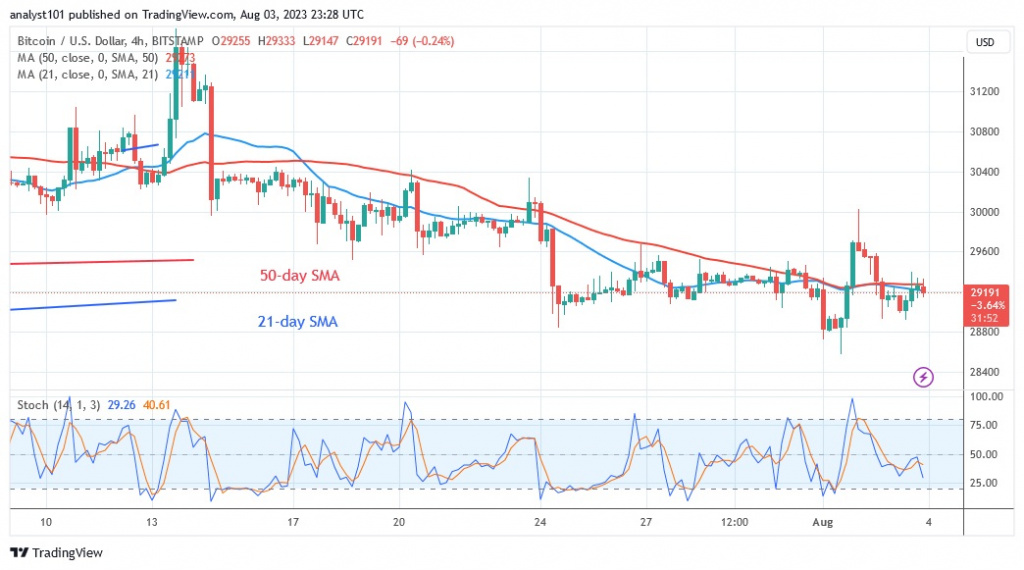
Since the 14th quarter, Bitcoin has been trading in the bearish trend zone at a Relative Strength Index value of 43. The price bars are currently below the moving average line but above the $29,000 support. The BTC price has fallen below the value of 40 of the Daily Stochastic. The downward trend has slowed down.

Technical Indicators:
Key resistance levels – $30,000 and $35,000
Key support levels – $20,000 and $15,000
What is the next direction for BTC/USD?
BTC/USD has been stagnant since the price collapse on July 24. Doji candles dominate the BTC price as it consolidates above the $29,000 support. The candlesticks symbolize the disinterest of buyers and sellers in the direction of the market.

Disclaimer. This analysis and forecast are the personal opinions of the author and are not a recommendation to buy or sell cryptocurrency and should not be viewed as an endorsement by CoinIdol.com. Readers should do their research before investing in funds.
Price
Coin expert
Price
News
Coin expert

(0 comments)